
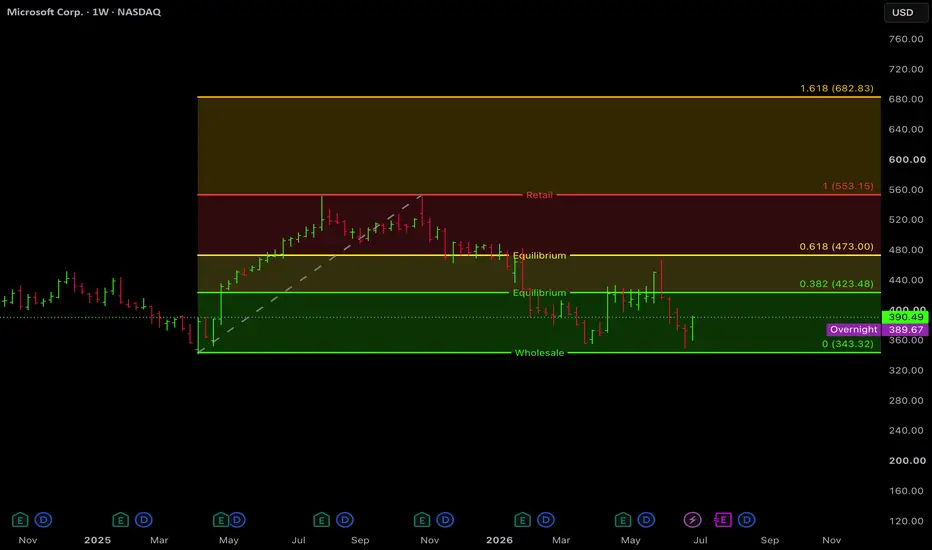
What I'm seeing
MSFT peaked ~$555 in late 2025 and flushed to $349 on June 25 worst month for the name since 2000. Current bounce to ~$390 sits inside a confirmed Weinstein Stage 4 downtrend on the weekly:
- Price well below the 30-week SMA
- Descending upper fractal trendline intact since the highs
-Lower fractal broken breakdown confirmed
- ATR-multiple sell signal fired near the Nov 2025 peak; no buy signal since
- Anchored VWAP (from highest-volume node at the top) sits ~$403 price below it means the average buyer from the peak is underwater. That's overhead supply on every rally.
Why it matters
The fundamentals did NOT cause this. Revenue +18% YoY, EPS beating every quarter, $25.6B quarterly FCF. The entire drawdown was multiple compression P/E de-rated from ~38x to ~23x on AI capex ROI fear. That's a narrative repricing, not an earnings problem. Which means the chart, not the income statement, tells you when it's over.
The levels:
$356 — line in the sand (Fib 100%). Held the June 25 flush. Lose it convincingly → next cluster $344–320
$398–403 — first real test. Weekly SMA20 + anchored VWAP confluence
$424–430 — prior consolidation / gap resistance above
What I expect
Default assumption in Stage 4: rallies get sold. The $349→$390 bounce has proven nothing yet.
Two conditions, no predictions:
Weekly reclaim + hold above $403 = first real evidence the repricing is done. Until then, this is a bounce inside a downtrend.
Convincing loss of $356 = repricing isn't finished. Retest is not off the table.
Strong business earns the watchlist.
Patience is a position. Not financial advice educational breakdown of my process.
MSFT peaked ~$555 in late 2025 and flushed to $349 on June 25 worst month for the name since 2000. Current bounce to ~$390 sits inside a confirmed Weinstein Stage 4 downtrend on the weekly:
- Price well below the 30-week SMA
- Descending upper fractal trendline intact since the highs
-Lower fractal broken breakdown confirmed
- ATR-multiple sell signal fired near the Nov 2025 peak; no buy signal since
- Anchored VWAP (from highest-volume node at the top) sits ~$403 price below it means the average buyer from the peak is underwater. That's overhead supply on every rally.
Why it matters
The fundamentals did NOT cause this. Revenue +18% YoY, EPS beating every quarter, $25.6B quarterly FCF. The entire drawdown was multiple compression P/E de-rated from ~38x to ~23x on AI capex ROI fear. That's a narrative repricing, not an earnings problem. Which means the chart, not the income statement, tells you when it's over.
The levels:
$356 — line in the sand (Fib 100%). Held the June 25 flush. Lose it convincingly → next cluster $344–320
$398–403 — first real test. Weekly SMA20 + anchored VWAP confluence
$424–430 — prior consolidation / gap resistance above
What I expect
Default assumption in Stage 4: rallies get sold. The $349→$390 bounce has proven nothing yet.
Two conditions, no predictions:
Weekly reclaim + hold above $403 = first real evidence the repricing is done. Until then, this is a bounce inside a downtrend.
Convincing loss of $356 = repricing isn't finished. Retest is not off the table.
Strong business earns the watchlist.
Patience is a position. Not financial advice educational breakdown of my process.

Pernyataan Penyangkalan
Informasi dan publikasi ini tidak dimaksudkan, dan bukan merupakan, saran atau rekomendasi keuangan, investasi, trading, atau jenis lainnya yang diberikan atau didukung oleh TradingView. Baca selengkapnya di Ketentuan Penggunaan.
Pernyataan Penyangkalan
Informasi dan publikasi ini tidak dimaksudkan, dan bukan merupakan, saran atau rekomendasi keuangan, investasi, trading, atau jenis lainnya yang diberikan atau didukung oleh TradingView. Baca selengkapnya di Ketentuan Penggunaan.