
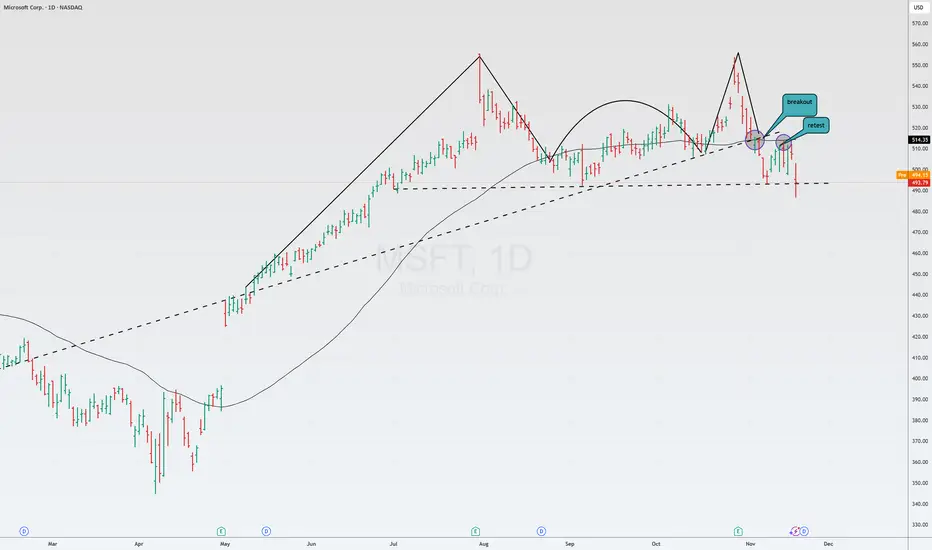
Microsoft is currently playing out a beautiful Batman pattern: having broken through the sloping trendline, retested, and also retested at 50 SMA.
However, yesterday, the market pulled the stock above the support level of 490-493, and traders may attempt a rebound after seeing a false breakout.
At the very least, going long in such a situation is very dangerous.
However, yesterday, the market pulled the stock above the support level of 490-493, and traders may attempt a rebound after seeing a false breakout.
At the very least, going long in such a situation is very dangerous.
Trading ditutup: target tercapai
In mid-November last year, we highlighted a developing technical pattern for $MSFT. Today, the shares are down over 10%, and there is reason to believe the decline will persist, and the market will at least test the $400The current sell-off is driven by the following factors:
Slowing Azure Growth: Growth in the cloud division has decelerated to 33–34% (adjusted). The market had anticipated a sharper acceleration fueled by the AI boom.
Surging Capex: Capital expenditures jumped 66% YoY, reaching $19 billion for the quarter (with $3.9 billion in financial leases)
OpenAI Concentration Risk: For the first time, it was revealed that OpenAI accounts for a significant portion of Microsoft's revenue momentum. Such high reliance on a single partner is perceived as a structural risk.
Soft Margin Guidance: The company’s operating margin guidance for the upcoming quarter (approx. 45.1%) fell short of analyst expectations.

Pernyataan Penyangkalan
Informasi dan publikasi ini tidak dimaksudkan, dan bukan merupakan, saran atau rekomendasi keuangan, investasi, trading, atau jenis lainnya yang diberikan atau didukung oleh TradingView. Baca selengkapnya di Ketentuan Penggunaan.
Pernyataan Penyangkalan
Informasi dan publikasi ini tidak dimaksudkan, dan bukan merupakan, saran atau rekomendasi keuangan, investasi, trading, atau jenis lainnya yang diberikan atau didukung oleh TradingView. Baca selengkapnya di Ketentuan Penggunaan.