
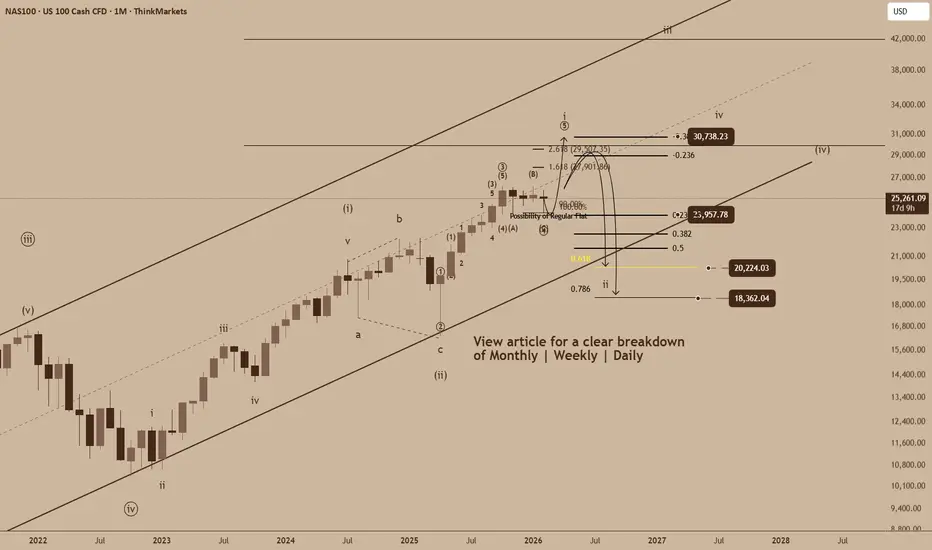
Monthly → Weekly → Daily Elliott Wave Breakdown
This analysis walks through NAS100 from the macro structure down to the lower-timeframe execution view.

1. Monthly Timeframe – Macro Trend Still Intact
On the monthly chart, NAS100 is clearly trending within a well-defined rising channel, respecting both the median line and the lower boundary across multiple cycles.
Elliott Wave Context (Monthly):
- Price appears to be in a larger impulsive structure, with wave (iii) and (iv) already completed.
- The market is currently in a wave (5) impulsive phase.
- This impulse to remain contained within the rising channel.
- Despite the correction risk, this remains a bullish market structurally unless price decisively breaks the lower channel boundary.

2. Weekly Timeframe – Impulsive Structure Taking Shape
The weekly chart adds clarity to the monthly impulse wave currently unfolding.
Elliott Wave Context (Weekly):
- The market appears to be developing an extended wave 3 from its current context.
- Currently, we are now looking at the completion of wave i - ii of (iii).
- Once wave i finishes its completion, wave ii targets may be expected between 0.618 and 0.786.
Technical Structure
- Price remains inside a rising corrective channel.
- A breakdown toward the lower boundary would complete the corrective phase.
- Holding above that boundary keeps the larger bullish thesis alive.

3. Daily Timeframe – Short-Term Volatility & Execution Zone
The daily chart is where the last phase of wave i becomes actionable.
Elliott Wave Context (Daily)
- A smaller wave 5 (encircled) is on its development.
- Minor wave (encircled) may still be forming, potentially as a regular flat. If not, then wave 5 (encircled) is confirmed.
- Once wave 1 (encircled) is reached, the daily timeframe analysis before the completion of wave 5 (encircled), the daily count becomes invalidated. However, this doesn't mean that the weekly and monthly outlook is invalidated as well. It will just require a recount in the Daily perspective to align it with the weekly and monthly timeframes.
Macro & Economic Factors to Watch
Several external forces may influence price behavior over the coming weeks and months:
1. Monetary Policy & Rates
- Markets remain sensitive to interest rate expectations
- Any persistence in higher-for-longer rates pressures growth-heavy indices like NAS100
2. Geopolitical Risk
- Ongoing geopolitical tensions add risk-off flows
- Tech equities often underperform during uncertainty spikes
3. Earnings & Valuation Compression
- High valuations leave little room for disappointment
- Even strong earnings can result in sell-the-news reactions
These factors support the technical case for a controlled correction, rather than an immediate continuation higher.
Outlook Summary
Long-term trend: Bullish and intact
Medium-term: Bullish
Short-term: Bullish followed by a Bearish movement
All Fibonacci measurements, from the smallest impulsive waves to the macro retracements, are converging toward the same zones, reinforcing the validity of the projected targets.
This analysis walks through NAS100 from the macro structure down to the lower-timeframe execution view.
1. Monthly Timeframe – Macro Trend Still Intact
On the monthly chart, NAS100 is clearly trending within a well-defined rising channel, respecting both the median line and the lower boundary across multiple cycles.
Elliott Wave Context (Monthly):
- Price appears to be in a larger impulsive structure, with wave (iii) and (iv) already completed.
- The market is currently in a wave (5) impulsive phase.
- This impulse to remain contained within the rising channel.
- Despite the correction risk, this remains a bullish market structurally unless price decisively breaks the lower channel boundary.
2. Weekly Timeframe – Impulsive Structure Taking Shape
The weekly chart adds clarity to the monthly impulse wave currently unfolding.
Elliott Wave Context (Weekly):
- The market appears to be developing an extended wave 3 from its current context.
- Currently, we are now looking at the completion of wave i - ii of (iii).
- Once wave i finishes its completion, wave ii targets may be expected between 0.618 and 0.786.
Technical Structure
- Price remains inside a rising corrective channel.
- A breakdown toward the lower boundary would complete the corrective phase.
- Holding above that boundary keeps the larger bullish thesis alive.
3. Daily Timeframe – Short-Term Volatility & Execution Zone
The daily chart is where the last phase of wave i becomes actionable.
Elliott Wave Context (Daily)
- A smaller wave 5 (encircled) is on its development.
- Minor wave (encircled) may still be forming, potentially as a regular flat. If not, then wave 5 (encircled) is confirmed.
- Once wave 1 (encircled) is reached, the daily timeframe analysis before the completion of wave 5 (encircled), the daily count becomes invalidated. However, this doesn't mean that the weekly and monthly outlook is invalidated as well. It will just require a recount in the Daily perspective to align it with the weekly and monthly timeframes.
Macro & Economic Factors to Watch
Several external forces may influence price behavior over the coming weeks and months:
1. Monetary Policy & Rates
- Markets remain sensitive to interest rate expectations
- Any persistence in higher-for-longer rates pressures growth-heavy indices like NAS100
2. Geopolitical Risk
- Ongoing geopolitical tensions add risk-off flows
- Tech equities often underperform during uncertainty spikes
3. Earnings & Valuation Compression
- High valuations leave little room for disappointment
- Even strong earnings can result in sell-the-news reactions
These factors support the technical case for a controlled correction, rather than an immediate continuation higher.
Outlook Summary
Long-term trend: Bullish and intact
Medium-term: Bullish
Short-term: Bullish followed by a Bearish movement
All Fibonacci measurements, from the smallest impulsive waves to the macro retracements, are converging toward the same zones, reinforcing the validity of the projected targets.

Publikasi terkait
Pernyataan Penyangkalan
Informasi dan publikasi ini tidak dimaksudkan, dan bukan merupakan, saran atau rekomendasi keuangan, investasi, trading, atau jenis lainnya yang diberikan atau didukung oleh TradingView. Baca selengkapnya di Ketentuan Penggunaan.
Publikasi terkait
Pernyataan Penyangkalan
Informasi dan publikasi ini tidak dimaksudkan, dan bukan merupakan, saran atau rekomendasi keuangan, investasi, trading, atau jenis lainnya yang diberikan atau didukung oleh TradingView. Baca selengkapnya di Ketentuan Penggunaan.