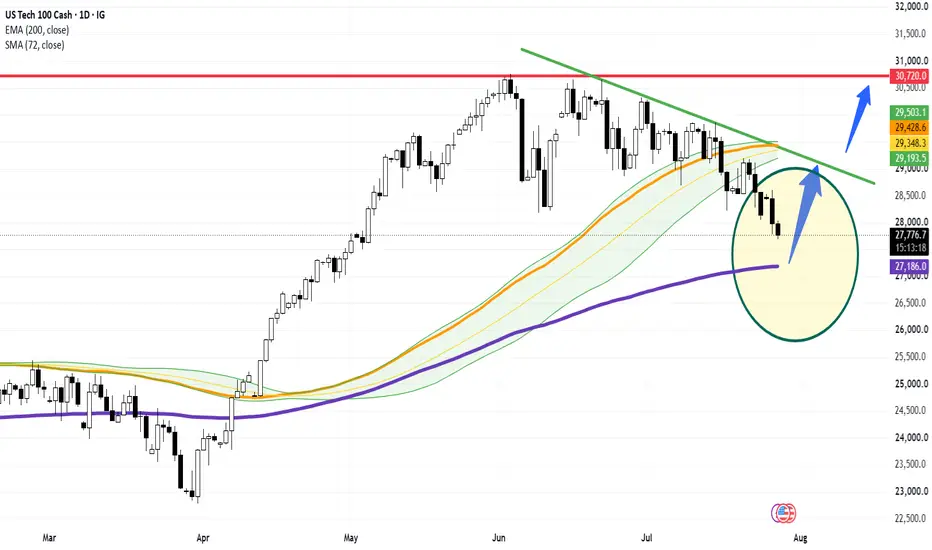
US Tech 100 ( NASDAQ) Daily: Testing 200-EMA Institutional Floor — Awaiting Bullish Trigger for Rebound Toward 30,720 Ceiling
### 🇺🇸 US Tech 100 Cash / Nasdaq (NASDAQ) Daily Technical Framework (Ref: NASDAQ_2026-07-28_08-41-12.png)
We are deploying a daily (1D) structural technical outlook on the US Tech 100 Index (NASDAQ). Following a multi-week corrective retracement from record high levels, price action is currently approaching an essential dynamic support threshold that defines the macro health of the tech-heavy benchmark.
The index is trading down today at **27,809.3 (-0.61%)**, steadily compressing toward its primary institutional floor.
---
### 🔍 Technical Architecture & Dynamic Confluence Node:
Our quantitative framework highlights a high-value demand zone marked within the highlighted yellow circle:
1. **The Institutional Floor (200-Period EMA):** The ongoing pullback is closing in on the long-term trend baseline at the **200-period EMA (purple line sitting at 27,186.3)**. Historically, this dynamic average serves as a primary institutional accumulation zone during major bull market pullbacks.
2. **The Dynamic Overhead Resistance Gauntlet:** Above current price action, initial recovery momentum will encounter resistance at the **72-period SMA ribbon cluster (tracked between 29,193.5 and 29,503.2)**, which aligns directly with the upper descending trendline (green LTB).
3. **Macro Target Ceiling (30,720.0):** The primary horizontal structural resistance remains firmly anchored at **30,720.0** (red horizontal line).
---
### 🚀 Projected Bullish Impulse Pathways (Blue Vectors):
We are awaiting a clear price action confirmation trigger (such as a strong bullish rejection candle or engulfing pattern) off the 200-EMA zone to validate the upside trajectory:
* **Trigger Condition:** Confirmation of buy-side absorption and daily closing strength near the **27,186.3** EMA 200 floor.
* **Vector 1 (Intermediate Rebound Target):** The initial recovery impulse (first blue vector) targets a retest of the descending green trendline and the **72-SMA ribbon zone (29,193.5 – 29,503.2)**.
* **Vector 2 (Macro Top Expansion):** A decisive breakout above the 29,500 moving average barrier clears the structural corridor for a secondary impulse leg (second blue vector) aiming directly for the **30,720.0** structural ceiling.
### 📊 Tactical Parameters Summary:
* **Current Bias:** Neutral / Awaiting Bullish Confirmation at Support
* **Institutional Demand Floor:** 27,186.3 (200-EMA Anchor)
* **Primary Dynamic Resistance (72-SMA / LTB):** 29,193.5 – 29,503.2
* **Macro Profit Target Ceiling:** 30,720.0
---
📊 **ChartPro Data**
*Tech Equity Architecture, Dynamic Support Sourcing & Systematic Risk Management.*
⚠️ **Disclaimer:** For educational and informational purposes only. This active market study represents a personal trading framework and does not constitute financial or investment advice.
NASDAQ) Daily: Testing 200-EMA Institutional Floor — Awaiting Bullish Trigger for Rebound Toward 30,720 Ceiling### 🇺🇸 US Tech 100 Cash / Nasdaq (
NASDAQ) Daily Technical Framework (Ref: NASDAQ_2026-07-28_08-41-12.png)We are deploying a daily (1D) structural technical outlook on the US Tech 100 Index (
NASDAQ). Following a multi-week corrective retracement from record high levels, price action is currently approaching an essential dynamic support threshold that defines the macro health of the tech-heavy benchmark.The index is trading down today at **27,809.3 (-0.61%)**, steadily compressing toward its primary institutional floor.
---
### 🔍 Technical Architecture & Dynamic Confluence Node:
Our quantitative framework highlights a high-value demand zone marked within the highlighted yellow circle:
1. **The Institutional Floor (200-Period EMA):** The ongoing pullback is closing in on the long-term trend baseline at the **200-period EMA (purple line sitting at 27,186.3)**. Historically, this dynamic average serves as a primary institutional accumulation zone during major bull market pullbacks.
2. **The Dynamic Overhead Resistance Gauntlet:** Above current price action, initial recovery momentum will encounter resistance at the **72-period SMA ribbon cluster (tracked between 29,193.5 and 29,503.2)**, which aligns directly with the upper descending trendline (green LTB).
3. **Macro Target Ceiling (30,720.0):** The primary horizontal structural resistance remains firmly anchored at **30,720.0** (red horizontal line).
---
### 🚀 Projected Bullish Impulse Pathways (Blue Vectors):
We are awaiting a clear price action confirmation trigger (such as a strong bullish rejection candle or engulfing pattern) off the 200-EMA zone to validate the upside trajectory:
* **Trigger Condition:** Confirmation of buy-side absorption and daily closing strength near the **27,186.3** EMA 200 floor.
* **Vector 1 (Intermediate Rebound Target):** The initial recovery impulse (first blue vector) targets a retest of the descending green trendline and the **72-SMA ribbon zone (29,193.5 – 29,503.2)**.
* **Vector 2 (Macro Top Expansion):** A decisive breakout above the 29,500 moving average barrier clears the structural corridor for a secondary impulse leg (second blue vector) aiming directly for the **30,720.0** structural ceiling.
### 📊 Tactical Parameters Summary:
* **Current Bias:** Neutral / Awaiting Bullish Confirmation at Support
* **Institutional Demand Floor:** 27,186.3 (200-EMA Anchor)
* **Primary Dynamic Resistance (72-SMA / LTB):** 29,193.5 – 29,503.2
* **Macro Profit Target Ceiling:** 30,720.0
---
📊 **ChartPro Data**
*Tech Equity Architecture, Dynamic Support Sourcing & Systematic Risk Management.*
⚠️ **Disclaimer:** For educational and informational purposes only. This active market study represents a personal trading framework and does not constitute financial or investment advice.

Pernyataan Penyangkalan
Informasi dan publikasi ini tidak dimaksudkan, dan bukan merupakan, saran atau rekomendasi keuangan, investasi, trading, atau jenis lainnya yang diberikan atau didukung oleh TradingView. Baca selengkapnya di Ketentuan Penggunaan.
Pernyataan Penyangkalan
Informasi dan publikasi ini tidak dimaksudkan, dan bukan merupakan, saran atau rekomendasi keuangan, investasi, trading, atau jenis lainnya yang diberikan atau didukung oleh TradingView. Baca selengkapnya di Ketentuan Penggunaan.