
*Due to the platform's features, the charts are arranged in sequence from left to right, from the first to the eighth chart. The charts were created by our team and based on an analysis from Bloomberg and the EIA data. This analysis was conducted in cooperation with Anastasia Volkova, analyst of LSE.
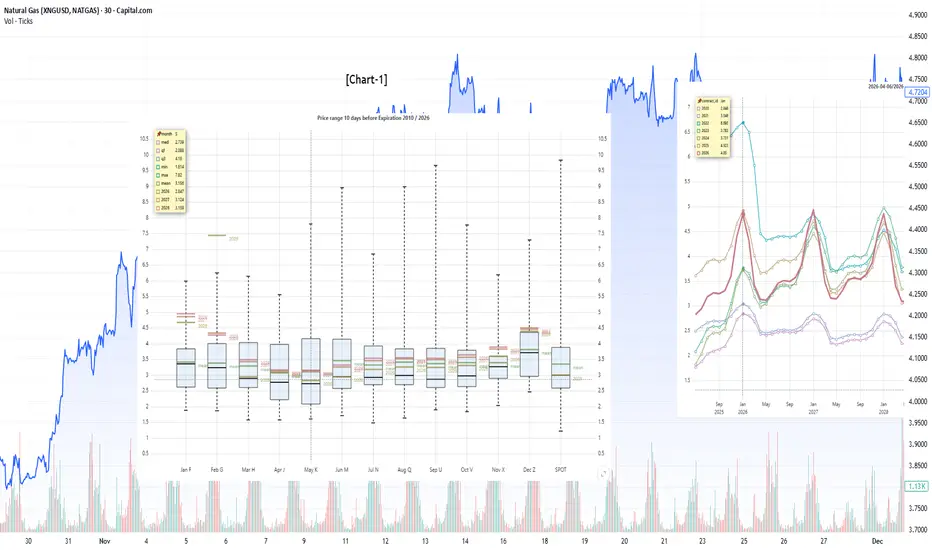
Current prices compared to the price range 10 days prior to expiration, by month, since 2010
[Chart-1]
The current price of the nearest April contract (J26) is near the lower end of the historical range for the 10-day period leading up to expiration and is close to the median values. For the summer months, the 2026 curve is generally around the median or slightly below it, with no significant weather premium. The most notable upward deviation persists in the winter contract Z26, which is trading above the average level and closer to the upper half of the historical range. For 2027 and 2028, values are also slightly higher than 2026 in the winter segment, but without an extreme deviation from historical data. Overall, the near end of the curve now looks noticeably calmer than in winter, and the market premium is concentrated mainly in the coming heating season.
Forward curve compared to 2020–2026
[Chart-2]
The 2026 forward curve is significantly lower than the 2022–2023 peaks and, overall, closer to the 2024–2025 trajectory. After the winter peak, the market moves into a range of around 3.7–4.0 during the summer months and then resumes seasonal growth heading into the winter of 2026/27. January 2027 remains one of the most expensive points on the curve, but no longer appears extreme compared to the crisis years. The distant segments for 2028–2030 maintain a stable seasonal sine wave without sharp spikes, which suggests a normalization of long-term expectations. Overall, the current curve reflects a moderate winter premium but not a scenario of acute shortage.
Current inventory levels and forecast for the coming week compared to 2021–2025
[Chart-3]
According to the current forecast for the week ending April 3, 2026, an injection of approximately +56 BCF into storage is expected. This is significantly higher than the average of about +13 BCF for this week and is at the upper end of the historical range, though it does not exceed the highs of previous years. Following the release, total inventory levels in the Lower 48 will be around 1.92 TCF, compared to an average of approximately 1.82 TCF. Compared to last year, inventories appear higher, which sets the stage for a more comfortable start to the injection season. Overall, the outlook appears moderately bearish for natural gas from an inventory perspective.
HDD+CDD based on current NOAA data and the forecast for the next two weeks, compared to 1995–2025
[Chart-4]
As of April 23, 2026, the combined HDD + CDD index for both models is nearly at the climatic norm: GEFS shows approximately 10.05, ECMWF approximately 10.56, with an average of approximately 10.31. After a brief spike in weather-related demand in the first ten days of April, the models have shifted toward a calmer scenario. Looking ahead to the second week, the forecast remains near normal, with no clear indication of either a sharp cold snap or early heat. This means that weather-driven support for gas demand will be limited in the coming days. Overall, the weather outlook is currently neutral for the gas market.
Daily Supply/Demand Gap Compared to 2015–2025
[Chart-5]
As of April 7, 2026, the demand/supply delta stands at approximately -1.9, compared to roughly +2.2 in 2025. This is weaker than last year’s level, but still better than the historical average of around -4.2 and significantly higher than the median of around -9.0 for this date. In other words, the current balance is weaker than last year’s but remains somewhat stronger than the seasonal norm. After April 10, the trajectory moves into more negative territory, indicating a weakening of fundamental support. Overall, the short-term signal for this indicator is neutral with a moderately bearish bias.
Number of delivery days from warehouses
[Chart-6]
As of April 7, 2026, the number of days’ supply from storage stands at approximately 16.2 days, compared to 15.7 days in 2025. This is slightly higher than last year’s level, but still notably below the seasonal average of about 20.4 days and below the lower bound of the historical average range. The indicator remains far from extreme lows, but a comfortable buffer to cover demand is still not in sight. The projected trajectory for the coming weeks is improving, but is only gradually trending upward. Overall, the metric remains moderately bullish for natural gas, though it does not indicate an acute shortage.
Filling levels at European storage facilities
[Chart-7]
As of April 7, 2026, the fill rate of European storage facilities stands at 28.61%, compared to 35.03% in 2025. This is virtually at the lower quartile of the historical distribution (27.19%) and significantly below the average of 38.39% for this date. Among major countries, the Netherlands, Germany, France, and Belgium look particularly weak, while higher levels persist in Portugal, Spain, Italy, and Poland. This picture means that Europe is entering the injection season with a tighter balance than last year. For the global gas market, this maintains sensitivity to LNG imports and to summer weather in Europe.
Electricity generation by source
[Chart-8]
In the US48 generation mix as of April 8, 2026, natural gas remains the largest source of electricity at around 35.3%, slightly above last year’s figure of 34.9% and close to the historical average. Coal-fired generation remains subdued and below its average level, limiting competition for gas. Hydroelectric generation is holding steady near normal levels, while nuclear generation is near average without providing any significant additional boost to gas. Meanwhile, solar generation is notably above normal, and wind is also above average, which is partially displacing gas from the energy mix. Overall, the power sector currently appears to have a neutral impact on gas demand: the weakness of coal supports the market, but strong renewables are taking away some of that support.
Current prices compared to the price range 10 days prior to expiration, by month, since 2010
[Chart-1]
The current price of the nearest April contract (J26) is near the lower end of the historical range for the 10-day period leading up to expiration and is close to the median values. For the summer months, the 2026 curve is generally around the median or slightly below it, with no significant weather premium. The most notable upward deviation persists in the winter contract Z26, which is trading above the average level and closer to the upper half of the historical range. For 2027 and 2028, values are also slightly higher than 2026 in the winter segment, but without an extreme deviation from historical data. Overall, the near end of the curve now looks noticeably calmer than in winter, and the market premium is concentrated mainly in the coming heating season.
Forward curve compared to 2020–2026
[Chart-2]
The 2026 forward curve is significantly lower than the 2022–2023 peaks and, overall, closer to the 2024–2025 trajectory. After the winter peak, the market moves into a range of around 3.7–4.0 during the summer months and then resumes seasonal growth heading into the winter of 2026/27. January 2027 remains one of the most expensive points on the curve, but no longer appears extreme compared to the crisis years. The distant segments for 2028–2030 maintain a stable seasonal sine wave without sharp spikes, which suggests a normalization of long-term expectations. Overall, the current curve reflects a moderate winter premium but not a scenario of acute shortage.
Current inventory levels and forecast for the coming week compared to 2021–2025
[Chart-3]
According to the current forecast for the week ending April 3, 2026, an injection of approximately +56 BCF into storage is expected. This is significantly higher than the average of about +13 BCF for this week and is at the upper end of the historical range, though it does not exceed the highs of previous years. Following the release, total inventory levels in the Lower 48 will be around 1.92 TCF, compared to an average of approximately 1.82 TCF. Compared to last year, inventories appear higher, which sets the stage for a more comfortable start to the injection season. Overall, the outlook appears moderately bearish for natural gas from an inventory perspective.
HDD+CDD based on current NOAA data and the forecast for the next two weeks, compared to 1995–2025
[Chart-4]
As of April 23, 2026, the combined HDD + CDD index for both models is nearly at the climatic norm: GEFS shows approximately 10.05, ECMWF approximately 10.56, with an average of approximately 10.31. After a brief spike in weather-related demand in the first ten days of April, the models have shifted toward a calmer scenario. Looking ahead to the second week, the forecast remains near normal, with no clear indication of either a sharp cold snap or early heat. This means that weather-driven support for gas demand will be limited in the coming days. Overall, the weather outlook is currently neutral for the gas market.
Daily Supply/Demand Gap Compared to 2015–2025
[Chart-5]
As of April 7, 2026, the demand/supply delta stands at approximately -1.9, compared to roughly +2.2 in 2025. This is weaker than last year’s level, but still better than the historical average of around -4.2 and significantly higher than the median of around -9.0 for this date. In other words, the current balance is weaker than last year’s but remains somewhat stronger than the seasonal norm. After April 10, the trajectory moves into more negative territory, indicating a weakening of fundamental support. Overall, the short-term signal for this indicator is neutral with a moderately bearish bias.
Number of delivery days from warehouses
[Chart-6]
As of April 7, 2026, the number of days’ supply from storage stands at approximately 16.2 days, compared to 15.7 days in 2025. This is slightly higher than last year’s level, but still notably below the seasonal average of about 20.4 days and below the lower bound of the historical average range. The indicator remains far from extreme lows, but a comfortable buffer to cover demand is still not in sight. The projected trajectory for the coming weeks is improving, but is only gradually trending upward. Overall, the metric remains moderately bullish for natural gas, though it does not indicate an acute shortage.
Filling levels at European storage facilities
[Chart-7]
As of April 7, 2026, the fill rate of European storage facilities stands at 28.61%, compared to 35.03% in 2025. This is virtually at the lower quartile of the historical distribution (27.19%) and significantly below the average of 38.39% for this date. Among major countries, the Netherlands, Germany, France, and Belgium look particularly weak, while higher levels persist in Portugal, Spain, Italy, and Poland. This picture means that Europe is entering the injection season with a tighter balance than last year. For the global gas market, this maintains sensitivity to LNG imports and to summer weather in Europe.
Electricity generation by source
[Chart-8]
In the US48 generation mix as of April 8, 2026, natural gas remains the largest source of electricity at around 35.3%, slightly above last year’s figure of 34.9% and close to the historical average. Coal-fired generation remains subdued and below its average level, limiting competition for gas. Hydroelectric generation is holding steady near normal levels, while nuclear generation is near average without providing any significant additional boost to gas. Meanwhile, solar generation is notably above normal, and wind is also above average, which is partially displacing gas from the energy mix. Overall, the power sector currently appears to have a neutral impact on gas demand: the weakness of coal supports the market, but strong renewables are taking away some of that support.

Pernyataan Penyangkalan
Informasi dan publikasi ini tidak dimaksudkan, dan bukan merupakan, saran atau rekomendasi keuangan, investasi, trading, atau jenis lainnya yang diberikan atau didukung oleh TradingView. Baca selengkapnya di Ketentuan Penggunaan.
Pernyataan Penyangkalan
Informasi dan publikasi ini tidak dimaksudkan, dan bukan merupakan, saran atau rekomendasi keuangan, investasi, trading, atau jenis lainnya yang diberikan atau didukung oleh TradingView. Baca selengkapnya di Ketentuan Penggunaan.