
Current price: ₹1,454
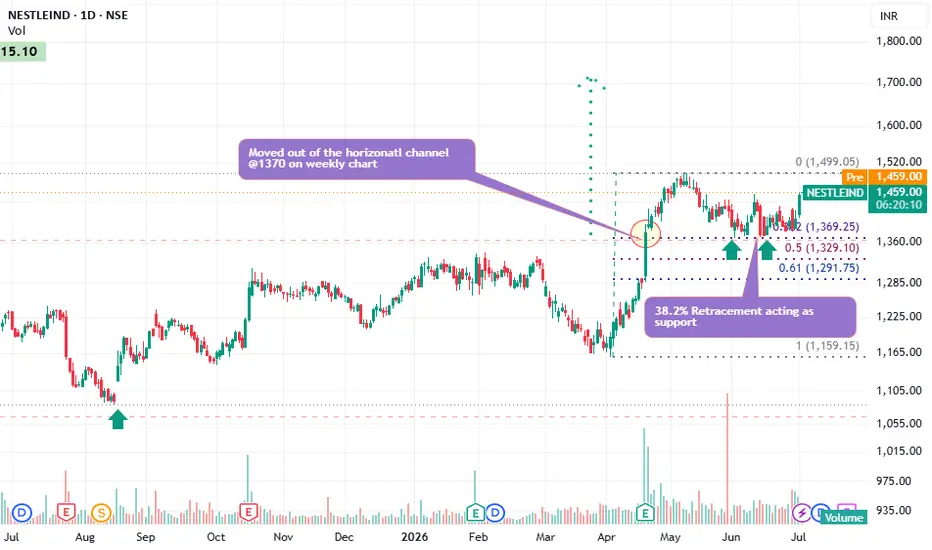
This is a daily chart of Nestlé India with a Fibonacci retracement drawn after a strong breakout. Here's the technical interpretation:
1. Weekly Breakout (Most Bullish Signal) ✅
The stock broke above the long-term horizontal resistance near ₹1,370 on the weekly chart.
Such breakouts after a prolonged consolidation often signal the start of a fresh uptrend.
The sharp rise from around ₹1,180 to ₹1,500 confirms strong buying interest.
Inference: Long-term trend has turned bullish.
2. Fibonacci Retracement
The Fibonacci tool is drawn from the swing low (~₹1,159) to the swing high (~₹1,499).
Key levels:
Fibonacci Level Price Significance
38.2% ₹1,369 Strong support
50% ₹1,329 Medium support
61.8% ₹1,292 Last major support
The stock has repeatedly bounced near ₹1,369, showing that buyers are defending this level.
3. Current Price Action
Current price: ₹1,454
Observations:
Trading above all important Fibonacci levels.
Making higher lows after the breakout.
Consolidating below ₹1,500 instead of falling sharply.
This is generally a sign of strength.
4. Volume Analysis
The breakout was accompanied by high volumes, indicating institutional participation.
During consolidation, volumes have reduced, which is healthy.
Ideally, the next breakout above ₹1,500 should again come with higher volume.
Overall Technical View
Trend: 🟢 Bullish
Momentum: Positive
Structure: Breakout followed by healthy consolidation
Support Strength: Strong at ₹1,370
Probability: As long as the stock holds above ₹1,370, the probability of a move above ₹1,500 remains favorable.
This is a daily chart of Nestlé India with a Fibonacci retracement drawn after a strong breakout. Here's the technical interpretation:
1. Weekly Breakout (Most Bullish Signal) ✅
The stock broke above the long-term horizontal resistance near ₹1,370 on the weekly chart.
Such breakouts after a prolonged consolidation often signal the start of a fresh uptrend.
The sharp rise from around ₹1,180 to ₹1,500 confirms strong buying interest.
Inference: Long-term trend has turned bullish.
2. Fibonacci Retracement
The Fibonacci tool is drawn from the swing low (~₹1,159) to the swing high (~₹1,499).
Key levels:
Fibonacci Level Price Significance
38.2% ₹1,369 Strong support
50% ₹1,329 Medium support
61.8% ₹1,292 Last major support
The stock has repeatedly bounced near ₹1,369, showing that buyers are defending this level.
3. Current Price Action
Current price: ₹1,454
Observations:
Trading above all important Fibonacci levels.
Making higher lows after the breakout.
Consolidating below ₹1,500 instead of falling sharply.
This is generally a sign of strength.
4. Volume Analysis
The breakout was accompanied by high volumes, indicating institutional participation.
During consolidation, volumes have reduced, which is healthy.
Ideally, the next breakout above ₹1,500 should again come with higher volume.
Overall Technical View
Trend: 🟢 Bullish
Momentum: Positive
Structure: Breakout followed by healthy consolidation
Support Strength: Strong at ₹1,370
Probability: As long as the stock holds above ₹1,370, the probability of a move above ₹1,500 remains favorable.

Pernyataan Penyangkalan
Informasi dan publikasi ini tidak dimaksudkan, dan bukan merupakan, saran atau rekomendasi keuangan, investasi, trading, atau jenis lainnya yang diberikan atau didukung oleh TradingView. Baca selengkapnya di Ketentuan Penggunaan.
Pernyataan Penyangkalan
Informasi dan publikasi ini tidak dimaksudkan, dan bukan merupakan, saran atau rekomendasi keuangan, investasi, trading, atau jenis lainnya yang diberikan atau didukung oleh TradingView. Baca selengkapnya di Ketentuan Penggunaan.