
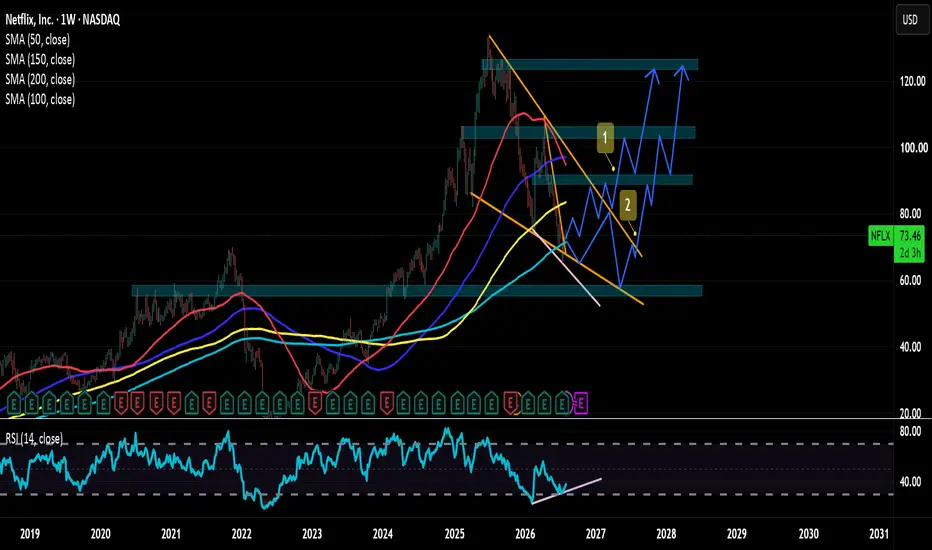
NFLX Weekly Reversal: Path to $123 📈
Netflix (NFLX): Bottom Is In!
NFLX: 200 SMA Bounce & Fundamental Discount.
📌 Market Context & Technical Breakdown
After a prolonged corrective phase, Netflix (NFLX) is showing strong technical and fundamental signs that its long-term bearish trend is near completion. The price action on the weekly chart is aligning with multiple confluence factors pointing toward a major bullish setup:
1. Rebound from 200 SMA & Wedge Bottom
Key Moving Average Support: The price recently tested and respected the 200-Period Simple Moving Average (200 SMA) on the weekly chart , which serves as a long-term macro trend floor.
Falling Wedge Pattern: NFLX has been contracting inside a multi-month descending wedge. The stock recently bounced cleanly off the bottom trendline of this structure, confirming robust demand at these structural lows.
2. Bullish RSI Momentum Divergence
Momentum Shift: While price printed lower lows into the bottom of the wedge, the RSI (14) registered distinct higher lows on the weekly chart.
Exhaustion Signal: This classic bullish divergence signals that seller exhaustion has set in, paving the way for buyers to initiate a new macro uptrend.
📊 Fundamental Valuation: Deep Discount
In addition to the technical reversal pattern, NFLX offers an attractive valuation metric for long-term investors:
P/E Ratio Compression: NFLX currently trades at a P/E of 23.32, which is historically very low compared to its long-term historical average P/E of 59.93.
Intrinsic Value Estimate: Based on an intrinsic value calculation of $120.00, NFLX is currently trading at roughly a 40% discount to its fair value.
🎯 Price Scenarios & Action Plan:
🟩 Scenario 1: Primary Path (High Probability)
Execution: Breakout and continuation through upper wedge resistance.
Targets:
Target 1: $90.00 (First major resistance / structural level)
Target 2: $103.00 (Key psychological & intermediate target)
Target 3: $123.00 (Major resistance coinciding with intrinsic value area)
🟦 Scenario 2: Deep Retest / Aggressive Buy Zone (Low Probability)
Trigger: A secondary market-wide pullback pushing NFLX down toward the $60.00 support level (bottom of the wedge).
Execution: Aggressive Buy Zone.
Next Targets: Upon holding $60.00 support, price is projected to resume the macro bullish path toward $90.00, $103.00, and $123.00.
Rationale: While the probability of retesting $60 is low given current momentum signals, any dip to this zone presents a prime, high-R/R accumulation opportunity for long-term investors.
🛡️ Risk Management Strategy
Approach: Long-Term Buy & Hold
Stop Loss: None Set
Rationale: Given the long-term investment horizon, deep fundamental undervaluation (~40% discount), and strong macro support at the 200 SMA, short-term market noise and volatility will be absorbed without setting a strict technical stop loss.
💡 Key Takeaway for Investors
The confluence of the 200 SMA support, wedge pattern bounce, weekly bullish RSI divergence, and a ~40% fundamental discount relative to intrinsic value indicates that the macro downtrend is nearly over. Investors should monitor the upper wedge breakout for continuation toward $90, $103, and $123.
Netflix (NFLX): Bottom Is In!
NFLX: 200 SMA Bounce & Fundamental Discount.
📌 Market Context & Technical Breakdown
After a prolonged corrective phase, Netflix (NFLX) is showing strong technical and fundamental signs that its long-term bearish trend is near completion. The price action on the weekly chart is aligning with multiple confluence factors pointing toward a major bullish setup:
1. Rebound from 200 SMA & Wedge Bottom
Key Moving Average Support: The price recently tested and respected the 200-Period Simple Moving Average (200 SMA) on the weekly chart , which serves as a long-term macro trend floor.
Falling Wedge Pattern: NFLX has been contracting inside a multi-month descending wedge. The stock recently bounced cleanly off the bottom trendline of this structure, confirming robust demand at these structural lows.
2. Bullish RSI Momentum Divergence
Momentum Shift: While price printed lower lows into the bottom of the wedge, the RSI (14) registered distinct higher lows on the weekly chart.
Exhaustion Signal: This classic bullish divergence signals that seller exhaustion has set in, paving the way for buyers to initiate a new macro uptrend.
📊 Fundamental Valuation: Deep Discount
In addition to the technical reversal pattern, NFLX offers an attractive valuation metric for long-term investors:
P/E Ratio Compression: NFLX currently trades at a P/E of 23.32, which is historically very low compared to its long-term historical average P/E of 59.93.
Intrinsic Value Estimate: Based on an intrinsic value calculation of $120.00, NFLX is currently trading at roughly a 40% discount to its fair value.
🎯 Price Scenarios & Action Plan:
🟩 Scenario 1: Primary Path (High Probability)
Execution: Breakout and continuation through upper wedge resistance.
Targets:
Target 1: $90.00 (First major resistance / structural level)
Target 2: $103.00 (Key psychological & intermediate target)
Target 3: $123.00 (Major resistance coinciding with intrinsic value area)
🟦 Scenario 2: Deep Retest / Aggressive Buy Zone (Low Probability)
Trigger: A secondary market-wide pullback pushing NFLX down toward the $60.00 support level (bottom of the wedge).
Execution: Aggressive Buy Zone.
Next Targets: Upon holding $60.00 support, price is projected to resume the macro bullish path toward $90.00, $103.00, and $123.00.
Rationale: While the probability of retesting $60 is low given current momentum signals, any dip to this zone presents a prime, high-R/R accumulation opportunity for long-term investors.
🛡️ Risk Management Strategy
Approach: Long-Term Buy & Hold
Stop Loss: None Set
Rationale: Given the long-term investment horizon, deep fundamental undervaluation (~40% discount), and strong macro support at the 200 SMA, short-term market noise and volatility will be absorbed without setting a strict technical stop loss.
💡 Key Takeaway for Investors
The confluence of the 200 SMA support, wedge pattern bounce, weekly bullish RSI divergence, and a ~40% fundamental discount relative to intrinsic value indicates that the macro downtrend is nearly over. Investors should monitor the upper wedge breakout for continuation toward $90, $103, and $123.
Trade aktif
Note for Investors: While this is structured as a long-term Buy & Hold investment without a strict stop loss, Targets 1, 2, and 3 serve as key valuation milestones to monitor performance, re-evaluate fundamental growth, and consider partial profit-taking as the stock approaches fair value ($120–$123).
Pernyataan Penyangkalan
Informasi dan publikasi ini tidak dimaksudkan, dan bukan merupakan, saran atau rekomendasi keuangan, investasi, trading, atau jenis lainnya yang diberikan atau didukung oleh TradingView. Baca selengkapnya di Ketentuan Penggunaan.
Pernyataan Penyangkalan
Informasi dan publikasi ini tidak dimaksudkan, dan bukan merupakan, saran atau rekomendasi keuangan, investasi, trading, atau jenis lainnya yang diberikan atau didukung oleh TradingView. Baca selengkapnya di Ketentuan Penggunaan.