
Hi Traders,
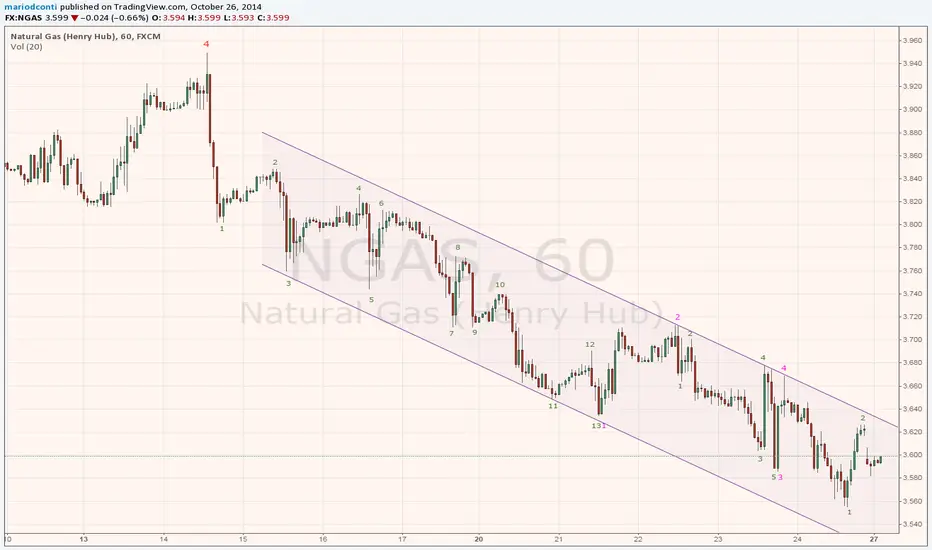
The end of the line of the downtrend of Natural Gas (now at 3601) is very much in sight. This sputtering downtrend is to be followed soon by a significant reversal that would mark the beginning of a major uptrend.
The attached 1-hour chart displays the sub-minuette waves 1 and 2 (in green, bottom right) as part of a group of a 5 waves down that should be completed at the beginning of the week.
At weekly and daily level, this is the very end of a major A-B-C retracement.
TARGETS
first down to the area 3515-3475
then up to the area 4163-4187
Cheers. Mario D. Conti
au.linkedin.com/in/sydneytraders/

Pernyataan Penyangkalan
Informasi dan publikasi ini tidak dimaksudkan, dan bukan merupakan, saran atau rekomendasi keuangan, investasi, trading, atau jenis lainnya yang diberikan atau didukung oleh TradingView. Baca selengkapnya di Ketentuan Penggunaan.
Pernyataan Penyangkalan
Informasi dan publikasi ini tidak dimaksudkan, dan bukan merupakan, saran atau rekomendasi keuangan, investasi, trading, atau jenis lainnya yang diberikan atau didukung oleh TradingView. Baca selengkapnya di Ketentuan Penggunaan.