
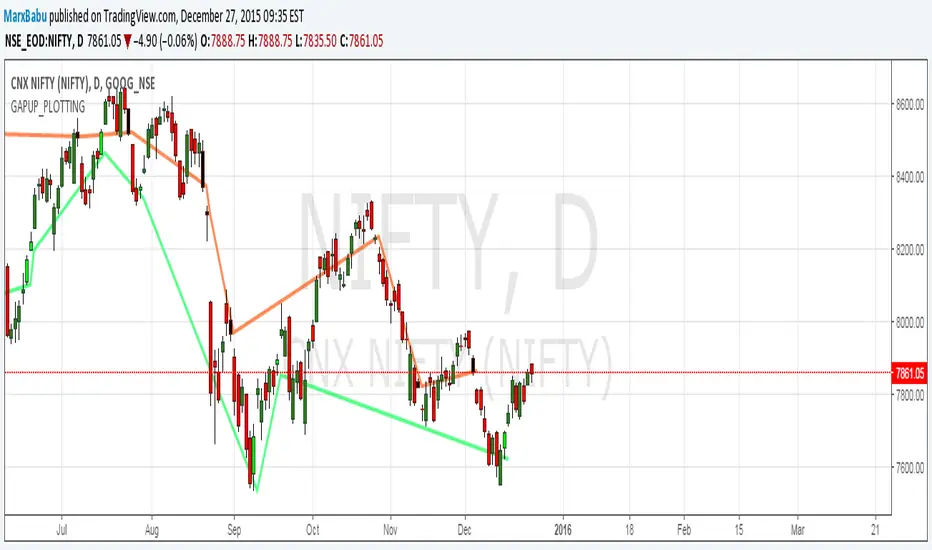
Identify the GAP up and GAP DOWN opening and plot the line.
Strategy when GAPUP identified Buy and target for few 100pips.
1.Color automated Lime candle shows one ahead candle of gapup
2.Black candle shows gapdown.
3.Line drawn for GapUp,GapDown
Strategy when GAPUP identified Buy and target for few 100pips.
1.Color automated Lime candle shows one ahead candle of gapup
2.Black candle shows gapdown.
3.Line drawn for GapUp,GapDown
Catatan
The code is available here//version=2
//Author MarxBabu
study(title="GAPUP_PLOTTING", overlay = true)
isUp() => close > open
isDown() => close <= open
//GAP UP DECISION
isGapUp()=> low>low[1] and low>open[1] and low >high[1] and low >close[1] and isUp()
isGapDown()=>high<low[1] and high<open[1] and high< close[1] and high<high[1] and isDown()
x = if isGapUp()
currentLowValue =low[1]
y = if isGapDown()
currentLowValue =close[1]
plot(x, style=line, linewidth=3, color=lime)
plot(y, style=line, linewidth=3, color=red)
barcolor(isGapUp()? #00FF00 :na,-1)
barcolor(isGapDown() ? #030303 :na,-1)

🌳Indicator:bit.ly/2DJVXDn 💚
🦄telegram:t.me/longbuylongsellindicator 🟢
✔️contact:t.me/wealthworldmajic
🎯web:marxcbabu.blogspot.com/
🟠twitter:twitter.com/marxcbabu 💲
youtube.com/@marxcbabu/videos
🦄telegram:t.me/longbuylongsellindicator 🟢
✔️contact:t.me/wealthworldmajic
🎯web:marxcbabu.blogspot.com/
🟠twitter:twitter.com/marxcbabu 💲
youtube.com/@marxcbabu/videos
Pernyataan Penyangkalan
Informasi dan publikasi ini tidak dimaksudkan, dan bukan merupakan, saran atau rekomendasi keuangan, investasi, trading, atau jenis lainnya yang diberikan atau didukung oleh TradingView. Baca selengkapnya di Ketentuan Penggunaan.
🌳Indicator:bit.ly/2DJVXDn 💚
🦄telegram:t.me/longbuylongsellindicator 🟢
✔️contact:t.me/wealthworldmajic
🎯web:marxcbabu.blogspot.com/
🟠twitter:twitter.com/marxcbabu 💲
youtube.com/@marxcbabu/videos
🦄telegram:t.me/longbuylongsellindicator 🟢
✔️contact:t.me/wealthworldmajic
🎯web:marxcbabu.blogspot.com/
🟠twitter:twitter.com/marxcbabu 💲
youtube.com/@marxcbabu/videos
Pernyataan Penyangkalan
Informasi dan publikasi ini tidak dimaksudkan, dan bukan merupakan, saran atau rekomendasi keuangan, investasi, trading, atau jenis lainnya yang diberikan atau didukung oleh TradingView. Baca selengkapnya di Ketentuan Penggunaan.