
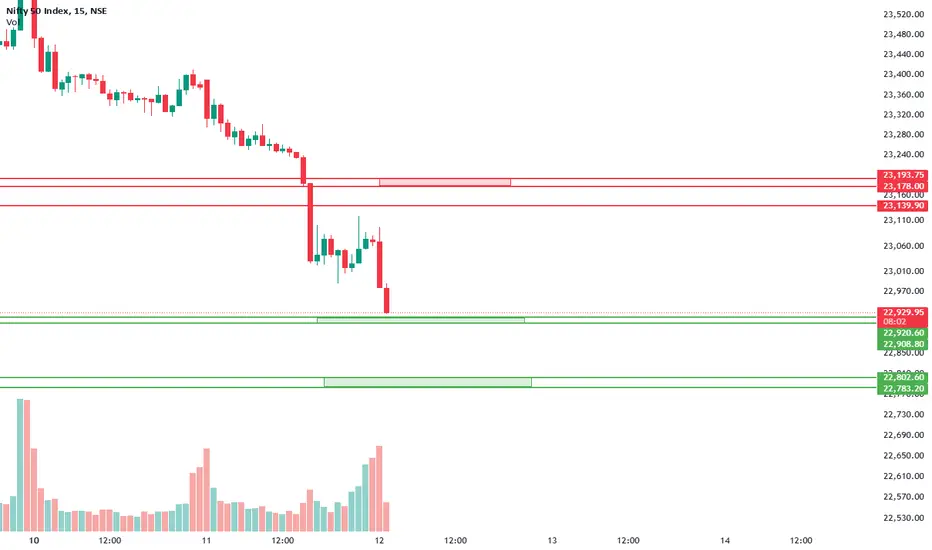
This chart shows support (green levels) and resistance (red levels):
Analysis of the Chart
Resistance Levels (Red)
1 . 23,139.90
2. 23,178.00 - 23,193.75
Support Levels (Green)
The price is currently testing support at around 22,929.95 - 22,920.60.
If this support holds, we may see a bounce back up.
If this level breaks, the price could fall to the next support zone at 22,802.60 - 22,783.20.
Analysis of the Chart
Resistance Levels (Red)
1 . 23,139.90
2. 23,178.00 - 23,193.75
Support Levels (Green)
The price is currently testing support at around 22,929.95 - 22,920.60.
If this support holds, we may see a bounce back up.
If this level breaks, the price could fall to the next support zone at 22,802.60 - 22,783.20.

Pernyataan Penyangkalan
Informasi dan publikasi ini tidak dimaksudkan, dan bukan merupakan, saran atau rekomendasi keuangan, investasi, trading, atau jenis lainnya yang diberikan atau didukung oleh TradingView. Baca selengkapnya di Ketentuan Penggunaan.
Pernyataan Penyangkalan
Informasi dan publikasi ini tidak dimaksudkan, dan bukan merupakan, saran atau rekomendasi keuangan, investasi, trading, atau jenis lainnya yang diberikan atau didukung oleh TradingView. Baca selengkapnya di Ketentuan Penggunaan.