
Dear trader,
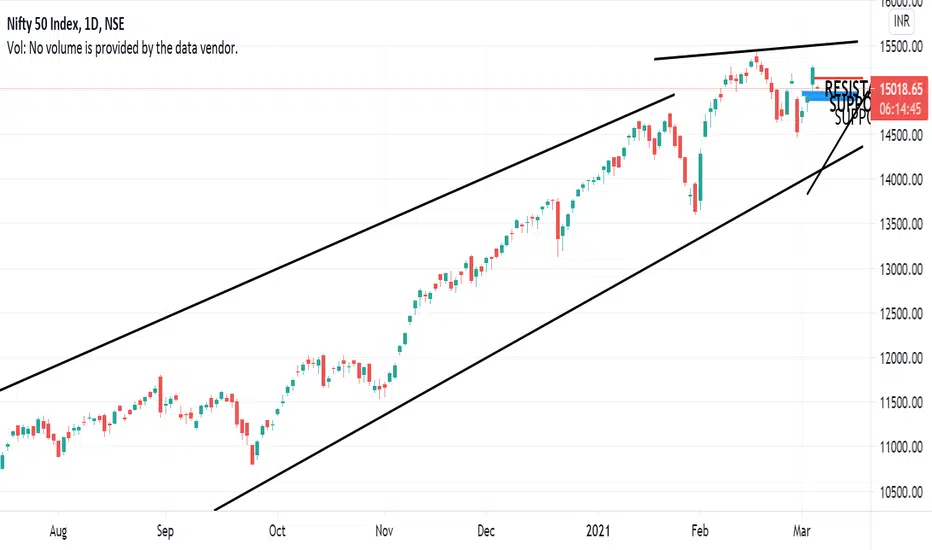
If u look at the chart of NIFTY (analysis based intraday only) the NIFTY support 1 at 14950 and support 2 at 14500 and resistance at 15130.
The chart clearly indicates Bullish Trend you can also see the candle stick patters for more indepth analysis. channel forming huge green candle. FII and DII figures turns positive. It appears the trend will continue
In Intraday most important thing is to enter and exit points.
Our signals are based on analytics, algorithms, mathematical derivatives.
Always be a responsible trader, kindly trade only when you have maximum opportunity in the market with minimum risk and with keynotes like data, analysis and proper strategies.
Kindly message us for strategies and analysis.
If u look at the chart of NIFTY (analysis based intraday only) the NIFTY support 1 at 14950 and support 2 at 14500 and resistance at 15130.
The chart clearly indicates Bullish Trend you can also see the candle stick patters for more indepth analysis. channel forming huge green candle. FII and DII figures turns positive. It appears the trend will continue
In Intraday most important thing is to enter and exit points.
Our signals are based on analytics, algorithms, mathematical derivatives.
Always be a responsible trader, kindly trade only when you have maximum opportunity in the market with minimum risk and with keynotes like data, analysis and proper strategies.
Kindly message us for strategies and analysis.

Pernyataan Penyangkalan
Informasi dan publikasi ini tidak dimaksudkan, dan bukan merupakan, saran atau rekomendasi keuangan, investasi, trading, atau jenis lainnya yang diberikan atau didukung oleh TradingView. Baca selengkapnya di Ketentuan Penggunaan.
Pernyataan Penyangkalan
Informasi dan publikasi ini tidak dimaksudkan, dan bukan merupakan, saran atau rekomendasi keuangan, investasi, trading, atau jenis lainnya yang diberikan atau didukung oleh TradingView. Baca selengkapnya di Ketentuan Penggunaan.