
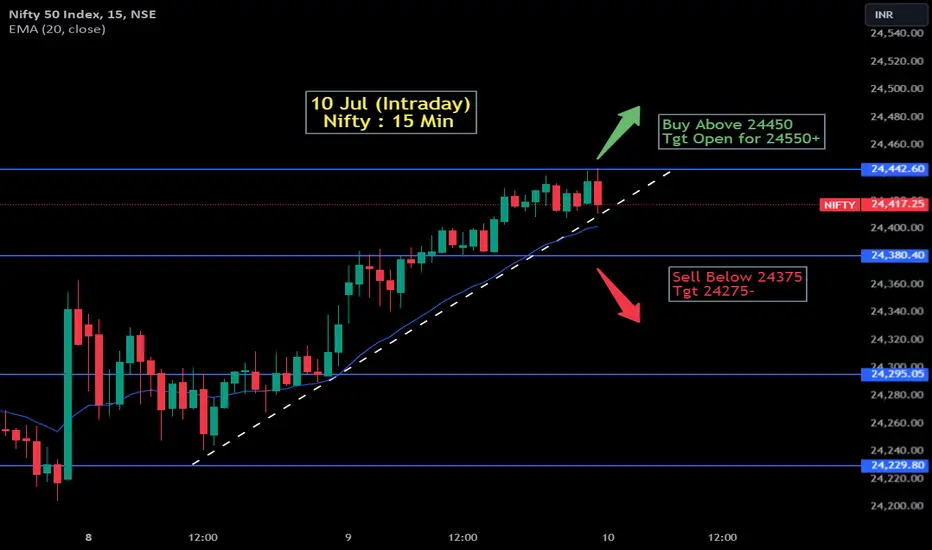
The image displays a chart for the Nifty 50 index from the National Stock Exchange of India, showing intraday movements on a 15-minute time frame. The chart includes details such as:
Date and Time: Published on July 9, 2024, at 18:55 IST.
Index Information: The Nifty 50 Index is shown at various prices, with the current price being 24,417.25, down by 16.80 points.
Technical Analysis: There's a 20-period Exponential Moving Average (EMA) indicated at 24,401.59.
Trading Recommendations:
-Buy Signal: A green arrow points upwards with a note to "Buy Above 24450" targeting an open position above 24,550.
-Sell Signal: A red arrow points downwards suggesting to "Sell Below 24375" with a target (Tgt) of 24,275 or lower.
Date and Time: Published on July 9, 2024, at 18:55 IST.
Index Information: The Nifty 50 Index is shown at various prices, with the current price being 24,417.25, down by 16.80 points.
Technical Analysis: There's a 20-period Exponential Moving Average (EMA) indicated at 24,401.59.
Trading Recommendations:
-Buy Signal: A green arrow points upwards with a note to "Buy Above 24450" targeting an open position above 24,550.
-Sell Signal: A red arrow points downwards suggesting to "Sell Below 24375" with a target (Tgt) of 24,275 or lower.

Pernyataan Penyangkalan
Informasi dan publikasi ini tidak dimaksudkan, dan bukan merupakan, saran atau rekomendasi keuangan, investasi, trading, atau jenis lainnya yang diberikan atau didukung oleh TradingView. Baca selengkapnya di Ketentuan Penggunaan.
Pernyataan Penyangkalan
Informasi dan publikasi ini tidak dimaksudkan, dan bukan merupakan, saran atau rekomendasi keuangan, investasi, trading, atau jenis lainnya yang diberikan atau didukung oleh TradingView. Baca selengkapnya di Ketentuan Penggunaan.