
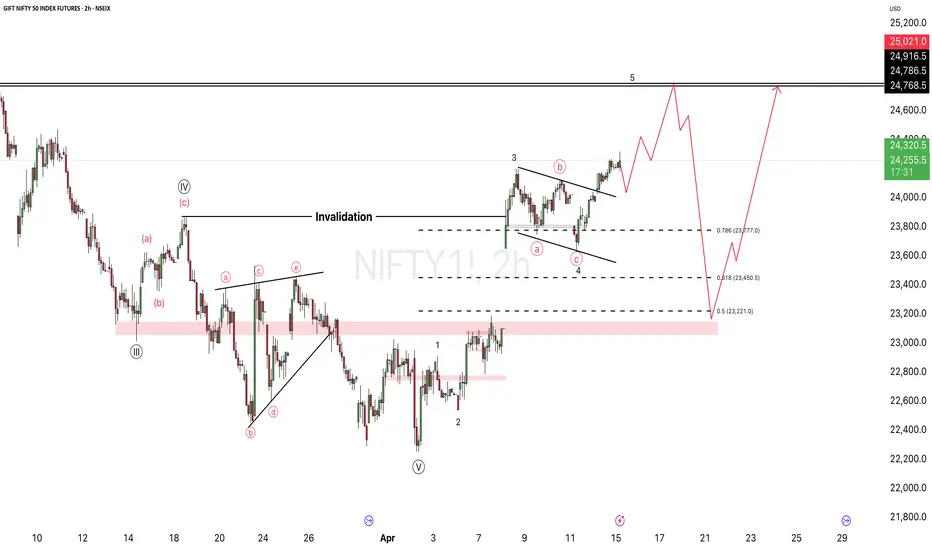
NIFTY is currently trading near 24,245–24,320 zone, and the chart structure continues to show a bullish Wave 5 setup after the recent Wave 4 correction.
The market has successfully respected the 23,777 breakout support, which remains the key level for bullish continuation.
🎯 Bullish Scenario
If price sustains above 24,200–24,250, the next leg of the move can extend toward:
24,768 – 24,786 🎯
This zone is the major resistance / Wave 5 completion area marked on the chart.
The projected move suggests a gradual push higher with minor pullbacks before reaching the target.
⚠️ Pullback / Trap Zone
A healthy correction remains possible before the final upside expansion.
Key retracement levels:
23,777 → immediate support
23,450 → strong demand zone
23,221 → 50% retracement level
If the market loses momentum near highs, a deeper retracement into 23,200 zone can happen before the next rally.
This makes the red path on your chart a possible liquidity sweep scenario before continuation.
🔥 Market View
Overall bias remains bullish unless 23,200 breaks decisively.
The structure still favors:
higher highs
higher lows
strong bullish continuation
Wave 5 target remains active.
The market has successfully respected the 23,777 breakout support, which remains the key level for bullish continuation.
🎯 Bullish Scenario
If price sustains above 24,200–24,250, the next leg of the move can extend toward:
24,768 – 24,786 🎯
This zone is the major resistance / Wave 5 completion area marked on the chart.
The projected move suggests a gradual push higher with minor pullbacks before reaching the target.
⚠️ Pullback / Trap Zone
A healthy correction remains possible before the final upside expansion.
Key retracement levels:
23,777 → immediate support
23,450 → strong demand zone
23,221 → 50% retracement level
If the market loses momentum near highs, a deeper retracement into 23,200 zone can happen before the next rally.
This makes the red path on your chart a possible liquidity sweep scenario before continuation.
🔥 Market View
Overall bias remains bullish unless 23,200 breaks decisively.
The structure still favors:
higher highs
higher lows
strong bullish continuation
Wave 5 target remains active.
Trade aktif
Current StructureStrong impulsive rally completed into Wave (3) near 24,390–24,420
Current pullback is retesting the 0.5–0.618 Fibonacci retracement zone
Important retracement support marked:
0.5 = 24,012
0.618 = 24,102
Price is currently holding around 24,143, which is still inside the healthy pullback zone
This suggests Wave 4 is forming a controlled correction, not a reversal.
Bullish Scenario
As long as price holds above the invalidation zone, this setup strongly favors Wave 5 upside continuation.
Upside Targets
Projected targets from your chart:
24,390–24,417 → immediate resistance retest
24,768–24,786 → major Wave 5 target zone
24,900+ → extended bullish momentum zone
This is where smart money typically pushes after a Wave 4 correction.
Invalidation Level
The most important support is:
24,000–24,012
If price closes below this zone on 2H, the Wave 5 setup weakens.
A deeper correction may then test:
23,850
23,700
Trade Setup
Buy on dips: 24,100–24,150
SL: below 24,000
Targets: 24,420 / 24,780 / 24,900
Risk-reward here looks very strong if support holds 🎯

Pernyataan Penyangkalan
Informasi dan publikasi ini tidak dimaksudkan, dan bukan merupakan, saran atau rekomendasi keuangan, investasi, trading, atau jenis lainnya yang diberikan atau didukung oleh TradingView. Baca selengkapnya di Ketentuan Penggunaan.
Pernyataan Penyangkalan
Informasi dan publikasi ini tidak dimaksudkan, dan bukan merupakan, saran atau rekomendasi keuangan, investasi, trading, atau jenis lainnya yang diberikan atau didukung oleh TradingView. Baca selengkapnya di Ketentuan Penggunaan.