
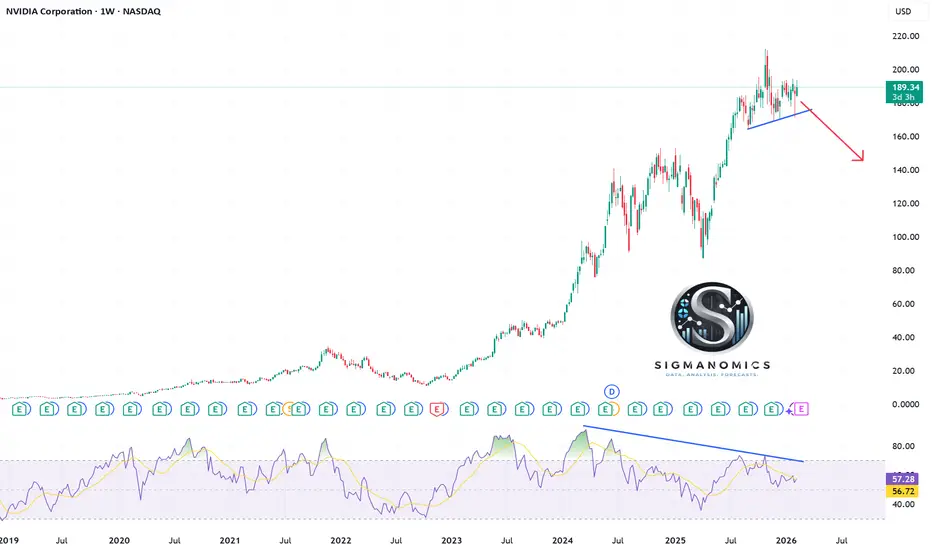
For those afraid of heights, Nvidia price action is warning of a correction in the medium term. To date, price action is holding above weekly trend line support at 176; however, a break below could expose a deeper pullback into the 150-140 zone, with the viewpoint supported by bearish RSI divergence that has developed since 2024. Meanwhile, there is a daily head and shoulders forming, with bears looking for confirmation on a break and close below support.

📊 Data. Analysis. Forecasts.
Cut through the noise → sigmanomics.com
📅 Never miss a market mover
Economic Calendar → sigmanomics.com/economic-calendar
🎯 Stop guessing. Start forecasting.
sigmanomics.com/forecasts
Cut through the noise → sigmanomics.com
📅 Never miss a market mover
Economic Calendar → sigmanomics.com/economic-calendar
🎯 Stop guessing. Start forecasting.
sigmanomics.com/forecasts
Pernyataan Penyangkalan
Informasi dan publikasi ini tidak dimaksudkan, dan bukan merupakan, saran atau rekomendasi keuangan, investasi, trading, atau jenis lainnya yang diberikan atau didukung oleh TradingView. Baca selengkapnya di Ketentuan Penggunaan.
📊 Data. Analysis. Forecasts.
Cut through the noise → sigmanomics.com
📅 Never miss a market mover
Economic Calendar → sigmanomics.com/economic-calendar
🎯 Stop guessing. Start forecasting.
sigmanomics.com/forecasts
Cut through the noise → sigmanomics.com
📅 Never miss a market mover
Economic Calendar → sigmanomics.com/economic-calendar
🎯 Stop guessing. Start forecasting.
sigmanomics.com/forecasts
Pernyataan Penyangkalan
Informasi dan publikasi ini tidak dimaksudkan, dan bukan merupakan, saran atau rekomendasi keuangan, investasi, trading, atau jenis lainnya yang diberikan atau didukung oleh TradingView. Baca selengkapnya di Ketentuan Penggunaan.