
Trade Journal Entry
Pair: PENGU/USDT
Trade Type: Buy-side Trade
Date: Sat 04th Oct 2025
Time: 12.00 PM
Session: London to New York Session PM
Entry: 0.02959
Profit Level: 0.03513 (+18.72%)
Stop Level: 0.02903 (–1.87%)
Risk-Reward Ratio (RR): 10.26
Narrative
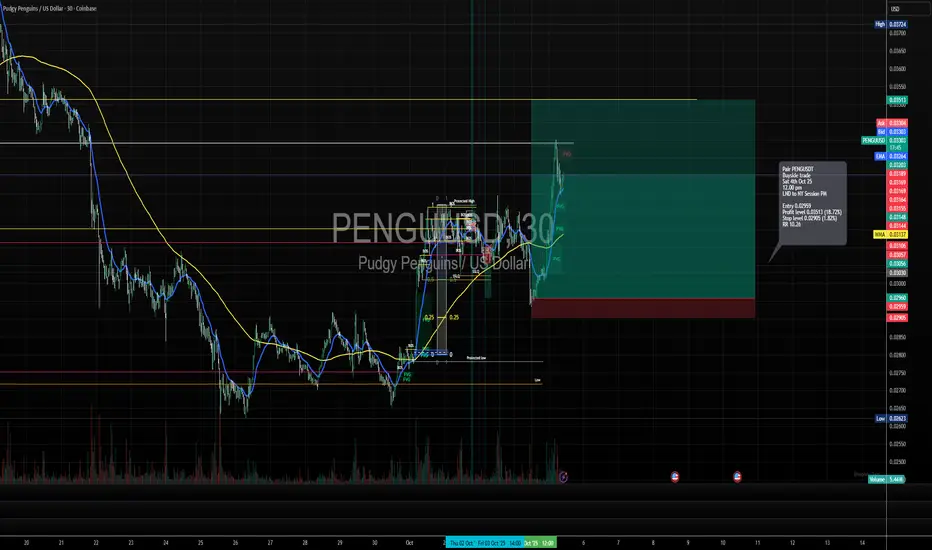
Following the accumulation phase around 0.02950, buyers stepped in with significant volume during the London to NY overlap. Price action confirmed a Break of Structure (BOS) on the 30-minute timeframe with a clean impulse leg. The entry aligns with FVG mitigation and bullish order flow continuation. Targets are positioned toward 0.0351 — the next liquidity pool and local swing high.

Market Context & Structure
The chart shows a strong bullish reversal following a prolonged downtrend.
Price broke above the 0.030 psychological level, flipping prior resistance into support.
Multiple Fair Value Gaps (FVGs) formed beneath the current price, offering valid re-entry zones if mitigated. Volume surged near the 0.02950–0.03100 area, suggesting institutional interest and demand absorption. The 50 EMA (blue) has crossed above the 200 EMA (yellow) — signalling a medium-term shift in structure.
Notably, the main impulse move occurred as the price retraced into the 0.25 level of the PD Array, aligning with a previous price range and discount as confluence.

Outlook
As long as price holds above the 0.031 zone (previous FVG + 50 EMA confluence), the structure remains bullish.
Pair: PENGU/USDT
Trade Type: Buy-side Trade
Date: Sat 04th Oct 2025
Time: 12.00 PM
Session: London to New York Session PM
Entry: 0.02959
Profit Level: 0.03513 (+18.72%)
Stop Level: 0.02903 (–1.87%)
Risk-Reward Ratio (RR): 10.26
Narrative
Following the accumulation phase around 0.02950, buyers stepped in with significant volume during the London to NY overlap. Price action confirmed a Break of Structure (BOS) on the 30-minute timeframe with a clean impulse leg. The entry aligns with FVG mitigation and bullish order flow continuation. Targets are positioned toward 0.0351 — the next liquidity pool and local swing high.
Market Context & Structure
The chart shows a strong bullish reversal following a prolonged downtrend.
Price broke above the 0.030 psychological level, flipping prior resistance into support.
Multiple Fair Value Gaps (FVGs) formed beneath the current price, offering valid re-entry zones if mitigated. Volume surged near the 0.02950–0.03100 area, suggesting institutional interest and demand absorption. The 50 EMA (blue) has crossed above the 200 EMA (yellow) — signalling a medium-term shift in structure.
Notably, the main impulse move occurred as the price retraced into the 0.25 level of the PD Array, aligning with a previous price range and discount as confluence.
Outlook
As long as price holds above the 0.031 zone (previous FVG + 50 EMA confluence), the structure remains bullish.
Trade aktif
RR 15.76
Profit level extended (Day TF overview)

Pernyataan Penyangkalan
Informasi dan publikasi ini tidak dimaksudkan, dan bukan merupakan, saran atau rekomendasi keuangan, investasi, trading, atau jenis lainnya yang diberikan atau didukung oleh TradingView. Baca selengkapnya di Ketentuan Penggunaan.
Pernyataan Penyangkalan
Informasi dan publikasi ini tidak dimaksudkan, dan bukan merupakan, saran atau rekomendasi keuangan, investasi, trading, atau jenis lainnya yang diberikan atau didukung oleh TradingView. Baca selengkapnya di Ketentuan Penggunaan.