
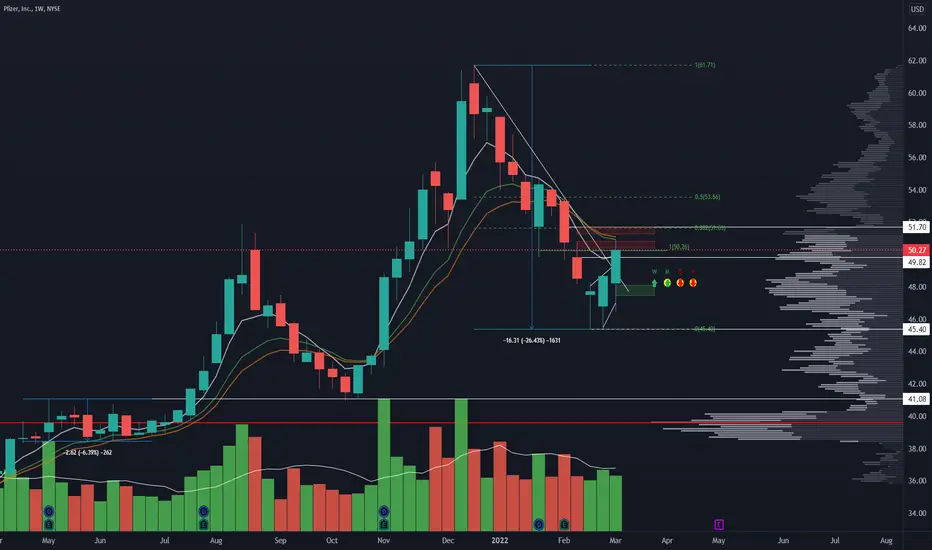
PFE Weekly Chart :
- Broke Downtrend trend line.
- Meet 10 EMA on the weekly = important resistance : we are seeing rejection of the 51-50 levels.
- Holding 48$ level is crucial for PFE to stay in it current uptrend. Above 51 PFE will likely go for the gap fill to reach around 52.70.
- With current market condition it is probable to have some kind of pullback next week : key point here is we need to see lower volume pullback with smaller candle than green candle. Optimal scenario is that we see a bounce back immediately after a pullback. That will signal relative strength and constant buying of the stock.

Pernyataan Penyangkalan
Informasi dan publikasi ini tidak dimaksudkan, dan bukan merupakan, saran atau rekomendasi keuangan, investasi, trading, atau jenis lainnya yang diberikan atau didukung oleh TradingView. Baca selengkapnya di Ketentuan Penggunaan.
Pernyataan Penyangkalan
Informasi dan publikasi ini tidak dimaksudkan, dan bukan merupakan, saran atau rekomendasi keuangan, investasi, trading, atau jenis lainnya yang diberikan atau didukung oleh TradingView. Baca selengkapnya di Ketentuan Penggunaan.