
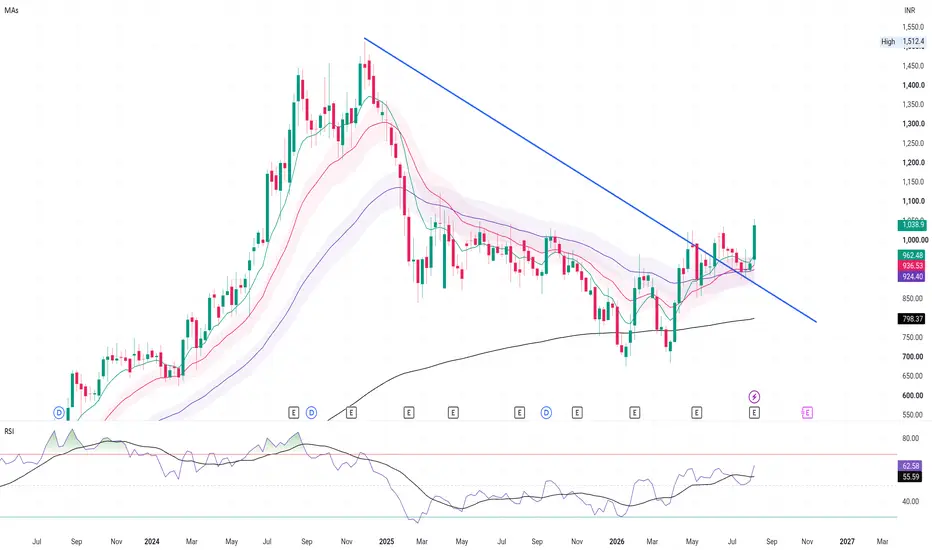
The long-term picture shows:
Huge uptrend → correction → multi-year consolidation → attempted breakout.
The stock went from roughly ₹200 to above ₹1,500 during the previous cycle and subsequently corrected heavily.
Now the structure is changing again.
Current:
₹1,036
Moving averages:
₹961.9
₹936.3
₹924.3
₹798.3
This is excellent technically.
Price is:
above all major moving averages.
And the shorter averages are stacked above the longer ones.
That's a bullish configuration.
Trendline
The most important thing on the chart:
The long descending trendline from the 2024/25 peak has been tested/broken.
Price is now attempting to establish itself above that trendline.
This is potentially a major regime change.
RSI
RSI:
62.3
with RSI average around 55.6.
Again:
strong but not excessively overheated.
That's ideal for a breakout continuation.
Levels
Immediate:
₹1,000–1,020
support zone.
Then:
₹1,050–1,080
is the confirmation zone.
If price gives a convincing weekly close above ₹1,080:
₹1,200
becomes the first meaningful target.
Then:
₹1,350
and eventually
₹1,500+
if the previous high cycle starts getting revisited.
Verdict
⭐⭐⭐⭐⭐
Trade aktif
cmp 1051.7
Pernyataan Penyangkalan
Informasi dan publikasi ini tidak dimaksudkan, dan bukan merupakan, saran atau rekomendasi keuangan, investasi, trading, atau jenis lainnya yang diberikan atau didukung oleh TradingView. Baca selengkapnya di Ketentuan Penggunaan.
Pernyataan Penyangkalan
Informasi dan publikasi ini tidak dimaksudkan, dan bukan merupakan, saran atau rekomendasi keuangan, investasi, trading, atau jenis lainnya yang diberikan atau didukung oleh TradingView. Baca selengkapnya di Ketentuan Penggunaan.