
StockDaDa Verdict
🟢 8.5/10 Setup
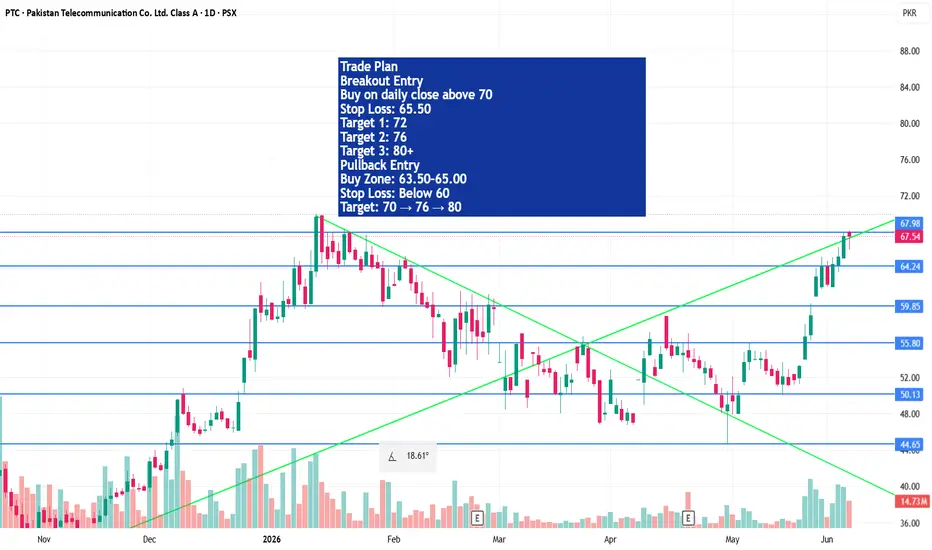
PTC is very close to a major breakout. A daily close above 70 can open the path toward 76–80 in the coming weeks.
🟢 Bullish Breakout in Progress
PTC has staged an impressive recovery from the 47–48 zone and is now testing a major resistance area around 68–70, which was the previous swing high zone.
Market Structure
✅ Higher Highs & Higher Lows established
✅ Strong momentum candles during the recent rally
✅ Volume expansion confirms institutional participation
✅ Price has reclaimed all major short-term resistance levels
Key Levels
Resistance
R1: 68.50–70.00 (major breakout zone)
R2: 72.00
R3: 76.00–78.00
Support
S1: 63.50–64.00
S2: 60.00
S3: 56.00 (trend invalidation area)
🟢 8.5/10 Setup
PTC is very close to a major breakout. A daily close above 70 can open the path toward 76–80 in the coming weeks.
🟢 Bullish Breakout in Progress
PTC has staged an impressive recovery from the 47–48 zone and is now testing a major resistance area around 68–70, which was the previous swing high zone.
Market Structure
✅ Higher Highs & Higher Lows established
✅ Strong momentum candles during the recent rally
✅ Volume expansion confirms institutional participation
✅ Price has reclaimed all major short-term resistance levels
Key Levels
Resistance
R1: 68.50–70.00 (major breakout zone)
R2: 72.00
R3: 76.00–78.00
Support
S1: 63.50–64.00
S2: 60.00
S3: 56.00 (trend invalidation area)

⚠️ Disclaimer:
This analysis is for educational purposes only and is not financial advice.
This analysis is for educational purposes only and is not financial advice.
Pernyataan Penyangkalan
Informasi dan publikasi ini tidak dimaksudkan, dan bukan merupakan, saran atau rekomendasi keuangan, investasi, trading, atau jenis lainnya yang diberikan atau didukung oleh TradingView. Baca selengkapnya di Ketentuan Penggunaan.
⚠️ Disclaimer:
This analysis is for educational purposes only and is not financial advice.
This analysis is for educational purposes only and is not financial advice.
Pernyataan Penyangkalan
Informasi dan publikasi ini tidak dimaksudkan, dan bukan merupakan, saran atau rekomendasi keuangan, investasi, trading, atau jenis lainnya yang diberikan atau didukung oleh TradingView. Baca selengkapnya di Ketentuan Penggunaan.