
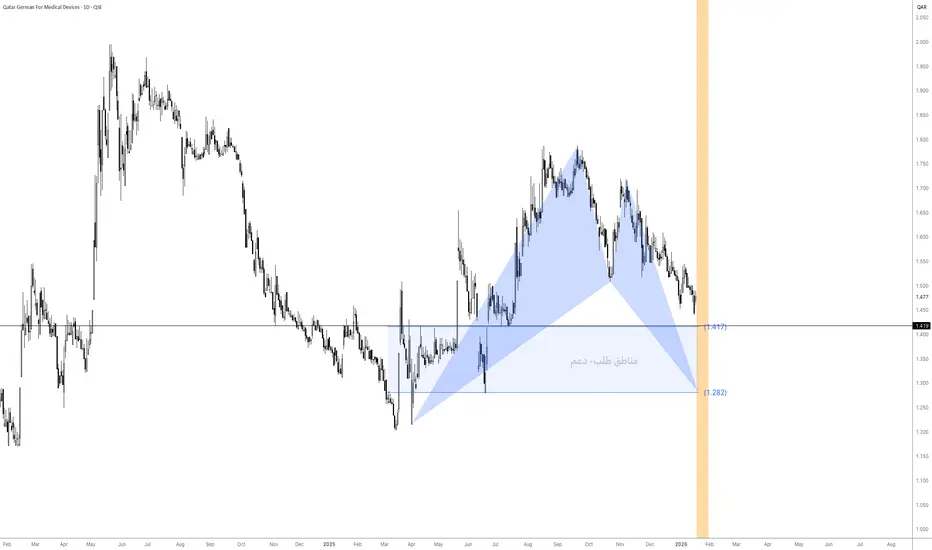
The medium-term trend is bearish, following a clear rejection from the previous highs around 1.75–1.80.
The current price action represents a corrective move within a broader downtrend, not a confirmed trend reversal.
🟦 Demand Zone (Support)
The highlighted blue zone marks a strong historical demand area:
Upper support: 1.417
Lower support: 1.282
This zone previously:
Triggered strong bullish impulses
Acted as a consolidation base
Produced multiple upside reactions
➡️ It is a selective accumulation zone, not a blind-buy area.
🟧 Current Price Context
Price is trading near the upper boundary of the demand zone (~1.42).
The market is testing support:
Holding above → potential rebound
Daily close below → weakness increases
🔻 Scenarios
✅ Bullish Scenario (Conditional)
Daily close holding above 1.417
Appearance of bullish rejection / weakening selling pressure
Potential upside targets:
1.55
1.65
1.72 (major resistance)
📌 This would be a corrective rally, not a confirmed trend reversal unless higher highs are formed.
❌ Bearish Scenario
Daily close below 1.417
Downside targets:
1.35
1.282 (key demand base)
A break below 1.282 would indicate structural breakdown and higher downside risk.

Pernyataan Penyangkalan
Informasi dan publikasi ini tidak dimaksudkan, dan bukan merupakan, saran atau rekomendasi keuangan, investasi, trading, atau jenis lainnya yang diberikan atau didukung oleh TradingView. Baca selengkapnya di Ketentuan Penggunaan.
Pernyataan Penyangkalan
Informasi dan publikasi ini tidak dimaksudkan, dan bukan merupakan, saran atau rekomendasi keuangan, investasi, trading, atau jenis lainnya yang diberikan atau didukung oleh TradingView. Baca selengkapnya di Ketentuan Penggunaan.