
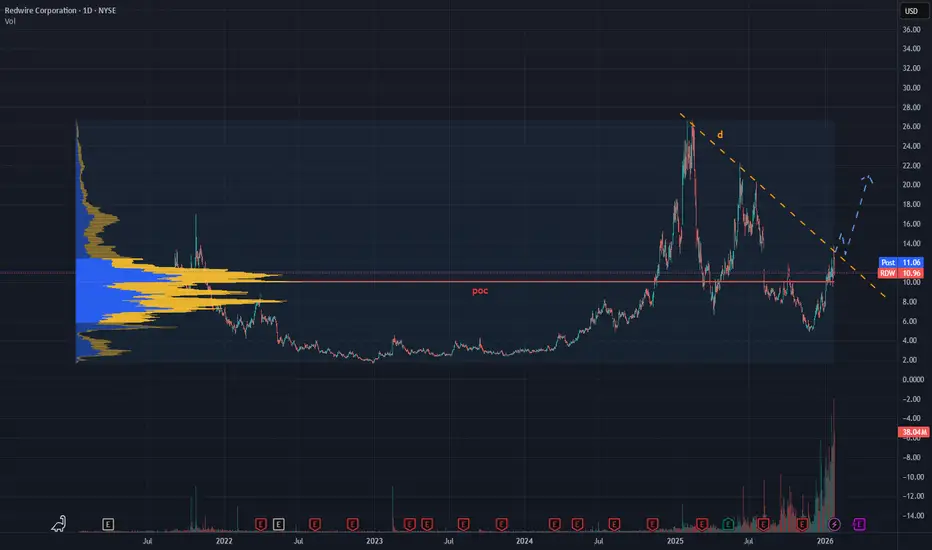
The stock RDW, which has been listed relatively recently, showed an interesting technical structure shortly after its IPO.
In the early trading phase, price action formed a classic Cup & Handle continuation pattern, later confirmed by a bullish breakout that led to a strong impulsive move, nearly doubling the price.

Market Structure
After setting a significant high, the stock entered a corrective phase, characterized by:
From a volume and market profile perspective:

Bullish Scenario
A long setup becomes technically valid only after a confirmed breakout above the daily descending trendline.
Key conditions:

⚠️ Trading Note
Until the bearish structure is broken, the stock remains in a corrective/consolidation phase.
A confirmed breakout would be the key signal to reassess bullish momentum and directional strength.
In the early trading phase, price action formed a classic Cup & Handle continuation pattern, later confirmed by a bullish breakout that led to a strong impulsive move, nearly doubling the price.
Market Structure
After setting a significant high, the stock entered a corrective phase, characterized by:
- lower highs
- lower lows
- a short- to medium-term bearish market structure
From a volume and market profile perspective:
- price is currently holding above the POC (Point of Control), a key level representing the area of highest traded volume
- the stock is trading just below a descending daily trendline, acting as a dynamic resistance
Bullish Scenario
A long setup becomes technically valid only after a confirmed breakout above the daily descending trendline.
Key conditions:
- clean breakout of the trendline
- decreasing or controlled volume, suggesting supply absorption rather than emotional buying
- potential retest of the broken trendline as dynamic support
⚠️ Trading Note
Until the bearish structure is broken, the stock remains in a corrective/consolidation phase.
A confirmed breakout would be the key signal to reassess bullish momentum and directional strength.

Pernyataan Penyangkalan
Informasi dan publikasi ini tidak dimaksudkan, dan bukan merupakan, saran atau rekomendasi keuangan, investasi, trading, atau jenis lainnya yang diberikan atau didukung oleh TradingView. Baca selengkapnya di Ketentuan Penggunaan.
Pernyataan Penyangkalan
Informasi dan publikasi ini tidak dimaksudkan, dan bukan merupakan, saran atau rekomendasi keuangan, investasi, trading, atau jenis lainnya yang diberikan atau didukung oleh TradingView. Baca selengkapnya di Ketentuan Penggunaan.