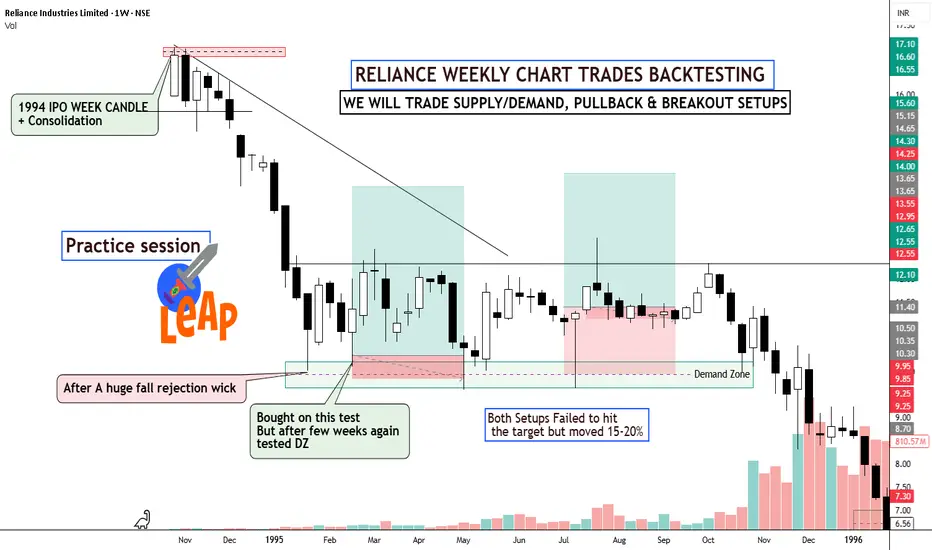
 RELIANCE
 Manual Backtesting Study | Supply–Demand • Pullbacks • Breakouts
I started from the weekly timeframe and moved the chart candle by candle, exactly the way price unfolds in real time.
The goal was simple:
⦿Understand where institutions likely accumulated or distributed
⦿Observe how price reacts at supply & demand zones
⦿Track pullback behavior in strong trends
⦿Validate breakouts only when structure and context align
Read the study Chart by chart
1.
2.
3.
4.
5.
6.
7.
8.
9.
10.
11.
12.
13.
14.
15.
16.
17.
Keep Learning,
Happy Trading.
Trade aktif
Chart 17 we left it at the supply zone in few days it has fallen alot, the supply zone defended and it unfolded massive fall.
Publikasi terkait
Pernyataan Penyangkalan
Informasi dan publikasi ini tidak dimaksudkan, dan bukan merupakan, saran atau rekomendasi keuangan, investasi, trading, atau jenis lainnya yang diberikan atau didukung oleh TradingView. Baca selengkapnya di Ketentuan Penggunaan.
Publikasi terkait
Pernyataan Penyangkalan
Informasi dan publikasi ini tidak dimaksudkan, dan bukan merupakan, saran atau rekomendasi keuangan, investasi, trading, atau jenis lainnya yang diberikan atau didukung oleh TradingView. Baca selengkapnya di Ketentuan Penggunaan.