
Rocket Lab has reached a fascinating technical inflection point.
After a powerful rally that nearly doubled the stock price in a short period, the market entered a healthy correction. Rather than chasing price, I've mapped out the bigger picture to identify where the next significant move could originate.
📈 The Bigger Picture
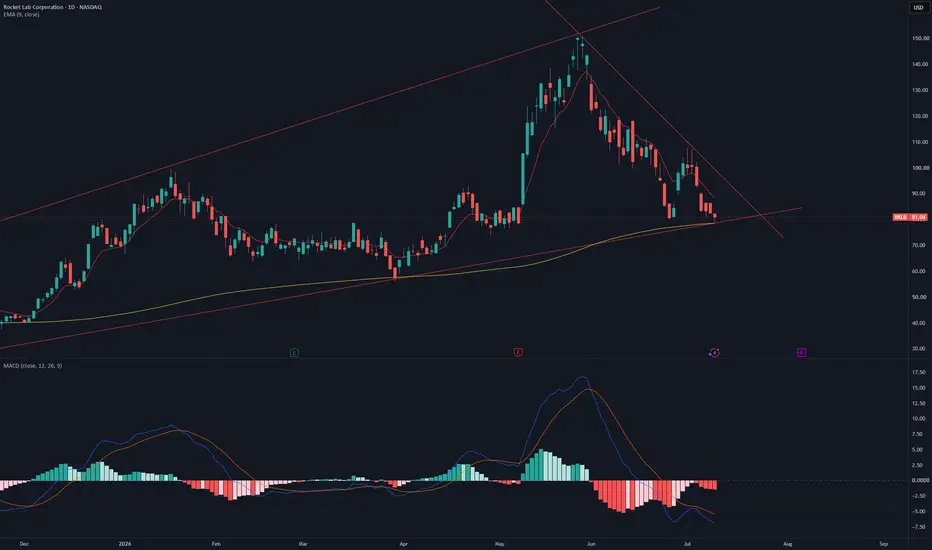
The ascending trendline (green support) has acted as the backbone of the longer-term uptrend, consistently producing higher lows over the past several months.
Despite the recent sell-off, that structure **remains intact**.
The correction has also created a series of **lower highs**, which are captured by the descending red trendline. This defines the current short-term bearish trend.
A Compression Pattern Is Emerging
Price is now trading between:
* Rising long-term support
* Falling short-term resistance
This creates a **symmetrical triangle**, where volatility compresses as buyers and sellers battle for control.
Historically, these patterns often precede a significant directional move—but they **do not predict the direction**. Confirmation is far more important than anticipation.
📊 Momentum
The MACD tells an equally interesting story.
Although momentum turned negative following the rally, the histogram is beginning to contract, suggesting bearish momentum is fading. This doesn't confirm a reversal, but it indicates that selling pressure is becoming less aggressive.
Levels I'm Watching
Bullish Case
* Price continues respecting ascending support.
* Breaks above the descending trendline with convincing volume.
* This would signal buyers are regaining control and could open the door to another attempt at higher highs.
Bearish Case
* Price loses the long-term ascending support.
* That would invalidate the current bullish structure and suggest the correction may have further to run before finding stronger demand.
My Take
I don't see this as a chart that requires predicting the next move. Instead, I see a chart approaching a *decision point*.
The longer-term trend is still constructive, while the shorter-term trend remains bearish. Eventually one of those trends will win.
For now, patience is the edge.
The next confirmed breakout—or breakdown—will likely determine Rocket Lab's next major move.
*This is my personal technical analysis based solely on price action and chart structure. It is not financial advice. Always do your own research before making investment decisions.*
After a powerful rally that nearly doubled the stock price in a short period, the market entered a healthy correction. Rather than chasing price, I've mapped out the bigger picture to identify where the next significant move could originate.
📈 The Bigger Picture
The ascending trendline (green support) has acted as the backbone of the longer-term uptrend, consistently producing higher lows over the past several months.
Despite the recent sell-off, that structure **remains intact**.
The correction has also created a series of **lower highs**, which are captured by the descending red trendline. This defines the current short-term bearish trend.
A Compression Pattern Is Emerging
Price is now trading between:
* Rising long-term support
* Falling short-term resistance
This creates a **symmetrical triangle**, where volatility compresses as buyers and sellers battle for control.
Historically, these patterns often precede a significant directional move—but they **do not predict the direction**. Confirmation is far more important than anticipation.
📊 Momentum
The MACD tells an equally interesting story.
Although momentum turned negative following the rally, the histogram is beginning to contract, suggesting bearish momentum is fading. This doesn't confirm a reversal, but it indicates that selling pressure is becoming less aggressive.
Levels I'm Watching
Bullish Case
* Price continues respecting ascending support.
* Breaks above the descending trendline with convincing volume.
* This would signal buyers are regaining control and could open the door to another attempt at higher highs.
Bearish Case
* Price loses the long-term ascending support.
* That would invalidate the current bullish structure and suggest the correction may have further to run before finding stronger demand.
My Take
I don't see this as a chart that requires predicting the next move. Instead, I see a chart approaching a *decision point*.
The longer-term trend is still constructive, while the shorter-term trend remains bearish. Eventually one of those trends will win.
For now, patience is the edge.
The next confirmed breakout—or breakdown—will likely determine Rocket Lab's next major move.
*This is my personal technical analysis based solely on price action and chart structure. It is not financial advice. Always do your own research before making investment decisions.*

Pernyataan Penyangkalan
Informasi dan publikasi ini tidak dimaksudkan, dan bukan merupakan, saran atau rekomendasi keuangan, investasi, trading, atau jenis lainnya yang diberikan atau didukung oleh TradingView. Baca selengkapnya di Ketentuan Penggunaan.
Pernyataan Penyangkalan
Informasi dan publikasi ini tidak dimaksudkan, dan bukan merupakan, saran atau rekomendasi keuangan, investasi, trading, atau jenis lainnya yang diberikan atau didukung oleh TradingView. Baca selengkapnya di Ketentuan Penggunaan.