Pembelian
Bullish RPL
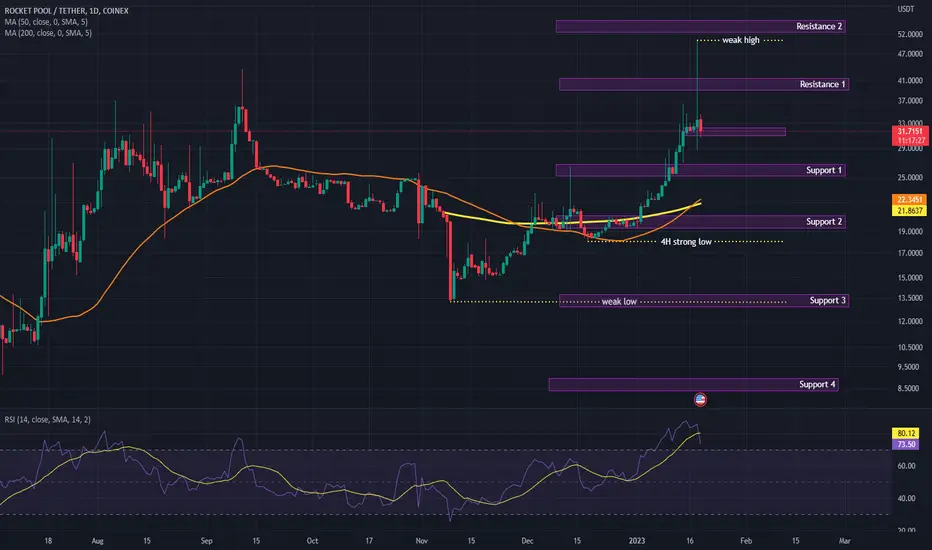
The chart above shows the 1Day chart of Rocket Pool 200-day and 50-day Moving Average (MA). RPL is on a bullish trend, as indicated in the recent uptrend.
Also, since the gap between the moving averages is small and within the recently formed candlesticks, the price of Rocket Pool (RPL) might experience a big rise or fall in the future.
From the chart above, we can observe that Rocket Pool (RPL) has been up to its listing price. Moreover, it seems like RPL is going rangebound when you look at the 1-day Chart. If RPL is able to break its weak high formed at $50.3511, we can expect RPL to trade above $80.
However, another possible scenario is that if RPL cannot break its weak high, RPL can reach back to its previous order block at $20.5403 and $19.3841, which is a downward stance.
Also, since the gap between the moving averages is small and within the recently formed candlesticks, the price of Rocket Pool (RPL) might experience a big rise or fall in the future.
From the chart above, we can observe that Rocket Pool (RPL) has been up to its listing price. Moreover, it seems like RPL is going rangebound when you look at the 1-day Chart. If RPL is able to break its weak high formed at $50.3511, we can expect RPL to trade above $80.
However, another possible scenario is that if RPL cannot break its weak high, RPL can reach back to its previous order block at $20.5403 and $19.3841, which is a downward stance.

Pernyataan Penyangkalan
Informasi dan publikasi ini tidak dimaksudkan, dan bukan merupakan, saran atau rekomendasi keuangan, investasi, trading, atau jenis lainnya yang diberikan atau didukung oleh TradingView. Baca selengkapnya di Ketentuan Penggunaan.
Pernyataan Penyangkalan
Informasi dan publikasi ini tidak dimaksudkan, dan bukan merupakan, saran atau rekomendasi keuangan, investasi, trading, atau jenis lainnya yang diberikan atau didukung oleh TradingView. Baca selengkapnya di Ketentuan Penggunaan.