
Is this the best breath indicator for the S&P 500?
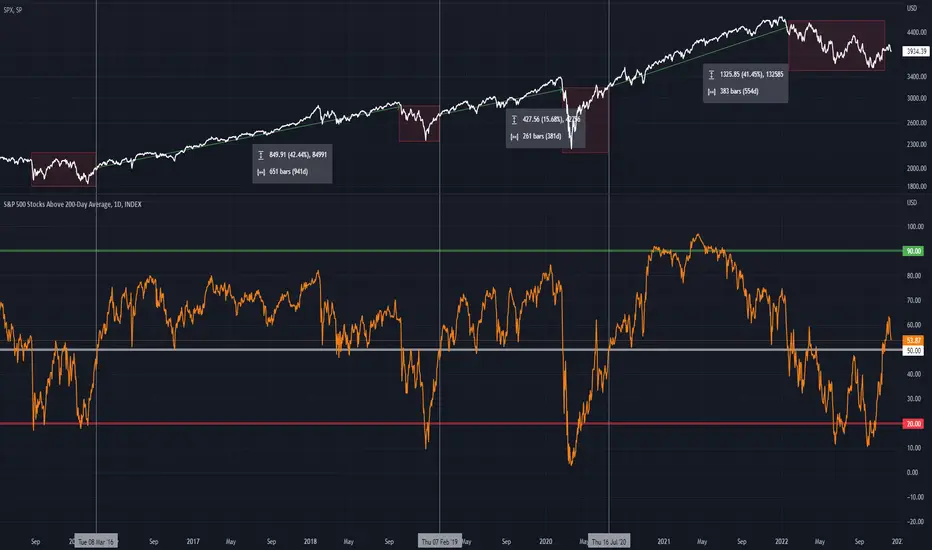
I don't know if I even have to explain this chart. Is just too easy to see.
The number of SPX stocks above its 200-day MA confirmes a bear market when crosses below 50, and confirms a bull market when crosses above the same level and stays there.
It has happened for the last 3 bear markets.
Also, is good to point out that is better to use it for bottoms than for tops. Everytime it touched 20, it was a mayor bottom for theSPX. For tops there has to be divergence.
This time, just like in the 2015-16 bear market, it crossed the 20 line two times. And the second time marked THE bottom. Will it be different this time?
As long as it doesn't goes below the 50 line again I'll behave as if we are in a bull market.
Don't wait for the news to catch up with the market.
The number of
SPX stocks above its 200-day MA confirmes a bear market when crosses below 50, and confirms a bull market when crosses above the same level and stays there.It has happened for the last 3 bear markets.
Also, is good to point out that is better to use it for bottoms than for tops. Everytime it touched 20, it was a mayor bottom for the
SPX. For tops there has to be divergence.This time, just like in the 2015-16 bear market, it crossed the 20 line two times. And the second time marked THE bottom. Will it be different this time?
As long as it doesn't goes below the 50 line again I'll behave as if we are in a bull market.
Don't wait for the news to catch up with the market.
Catatan
Back below 50Catatan
I'll do my best to backtest this idea in TradeStation
Publikasi terkait
Pernyataan Penyangkalan
Informasi dan publikasi ini tidak dimaksudkan, dan bukan merupakan, saran atau rekomendasi keuangan, investasi, trading, atau jenis lainnya yang diberikan atau didukung oleh TradingView. Baca selengkapnya di Ketentuan Penggunaan.
Publikasi terkait
Pernyataan Penyangkalan
Informasi dan publikasi ini tidak dimaksudkan, dan bukan merupakan, saran atau rekomendasi keuangan, investasi, trading, atau jenis lainnya yang diberikan atau didukung oleh TradingView. Baca selengkapnya di Ketentuan Penggunaan.