
Hello everyone!
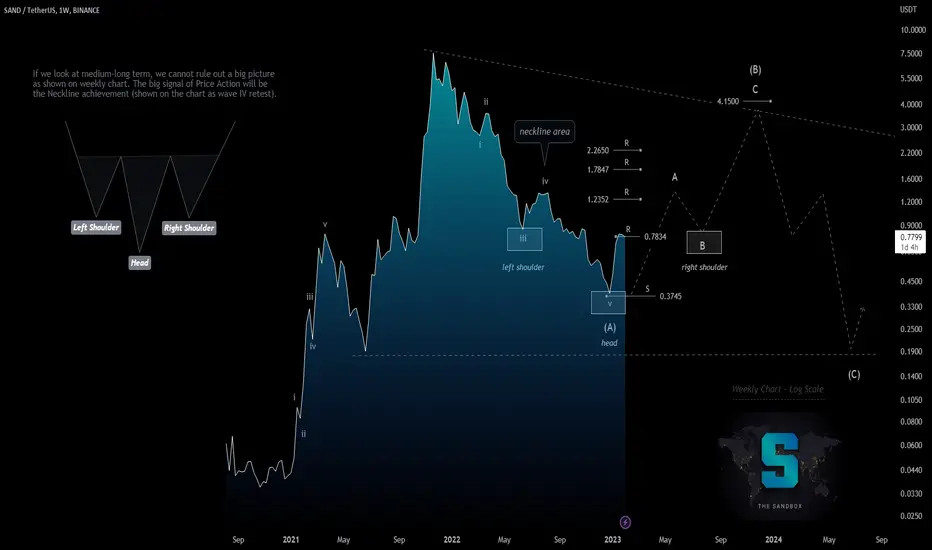
If we look at SAND in a medium-long term, we cannot rule out a big picture as shown on weekly chart. The big signal of Price Action will be the Neckline achievement (shown on chart as wave IV retest) of a large "Head & Shoulders". Working on daily time frame, I found some interesting resistance levels, useful for evaluating the strength of the trend, step by step.
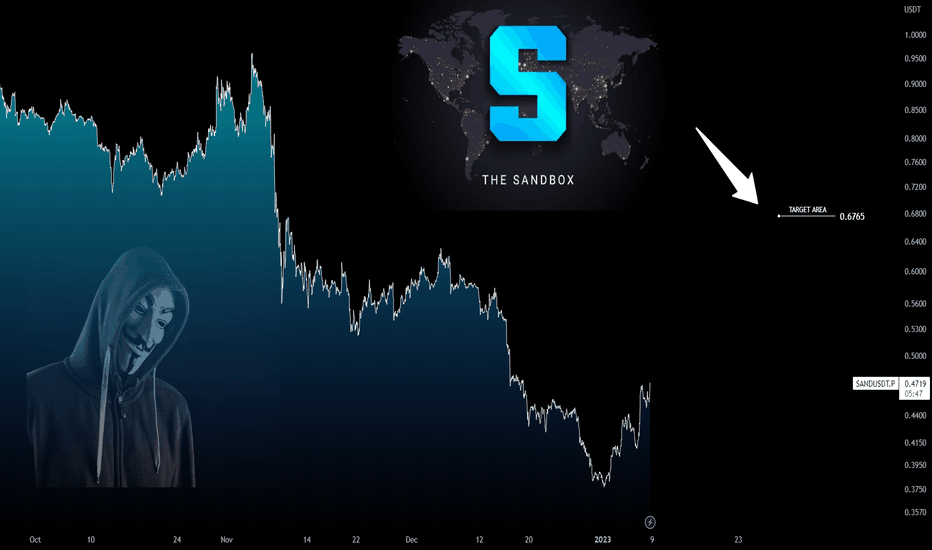
I came up with this idea thanks to our last trade on Sandbox, which developed a potential bullish impulse structure.
(Click and Play on Chart below)
If there are conditions, I will update this idea below.
...trade with care! 👍
Cheers!
If you think that my analysis is useful, please...
"Like, Share and Comment" ...thank you! 💖
If we look at
SAND in a medium-long term, we cannot rule out a big picture as shown on weekly chart. The big signal of Price Action will be the Neckline achievement (shown on chart as wave IV retest) of a large "Head & Shoulders". Working on daily time frame, I found some interesting resistance levels, useful for evaluating the strength of the trend, step by step.I came up with this idea thanks to our last trade on Sandbox, which developed a potential bullish impulse structure.
(Click and Play on Chart below)
If there are conditions, I will update this idea below.
...trade with care! 👍
Cheers!
If you think that my analysis is useful, please...
"Like, Share and Comment" ...thank you! 💖
Catatan
DAILY CHARTCatatan

Publikasi terkait
Pernyataan Penyangkalan
Informasi dan publikasi ini tidak dimaksudkan, dan bukan merupakan, saran atau rekomendasi keuangan, investasi, trading, atau jenis lainnya yang diberikan atau didukung oleh TradingView. Baca selengkapnya di Ketentuan Penggunaan.
Publikasi terkait
Pernyataan Penyangkalan
Informasi dan publikasi ini tidak dimaksudkan, dan bukan merupakan, saran atau rekomendasi keuangan, investasi, trading, atau jenis lainnya yang diberikan atau didukung oleh TradingView. Baca selengkapnya di Ketentuan Penggunaan.