
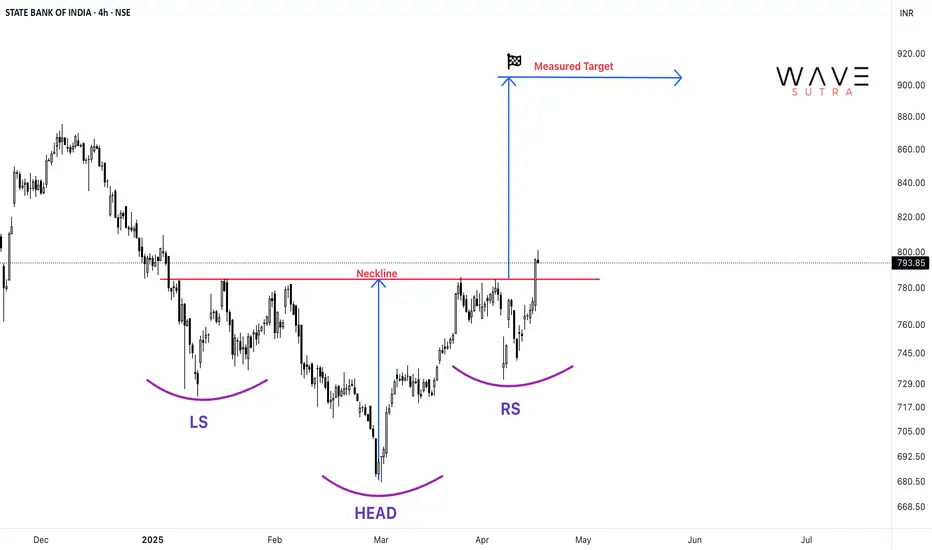
The Inverse Head and Shoulders pattern is a bullish reversal chart pattern that signals a potential trend reversal from bearish to bullish. It consists of three key components:
Structure of the Pattern:
Left Shoulder: A price decline followed by a temporary rally.
Head: A deeper decline forming the lowest point, followed by another rally.
Right Shoulder: A decline similar in size to the left shoulder but not as deep as the head, followed by a move higher.
Neckline: A resistance level that connects the highs of the two rallies after the left shoulder and head.
The Inverse Head and Shoulders pattern in SBI, with a neckline at ₹783, indicates a potential bullish reversal. The stock has formed a well-defined left shoulder, head, and right shoulder, suggesting that selling pressure is weakening. The target price for this breakout is ₹900 calculated by measuring the distance from the head’s low to the neckline and projecting it upwards. If the stock sustains above the neckline, it could gain further momentum. However, traders should consider placing a stop-loss at 730 to manage risk in case of a failed breakout.

Manish Bhardwaj (CMT L-1)
Analyst & Co-Founder
tradingsutra.com
waveutra.com
INSTAGRAM-
instagram.com/mansh_25
TWITTER-
twitter.com/mansh_25
YOUTUBE -
@TRADINGSUTRA @WAVESUTRA
Analyst & Co-Founder
tradingsutra.com
waveutra.com
INSTAGRAM-
instagram.com/mansh_25
TWITTER-
twitter.com/mansh_25
YOUTUBE -
@TRADINGSUTRA @WAVESUTRA
Publikasi terkait
Pernyataan Penyangkalan
Informasi dan publikasi ini tidak dimaksudkan, dan bukan merupakan, saran atau rekomendasi keuangan, investasi, trading, atau jenis lainnya yang diberikan atau didukung oleh TradingView. Baca selengkapnya di Ketentuan Penggunaan.