
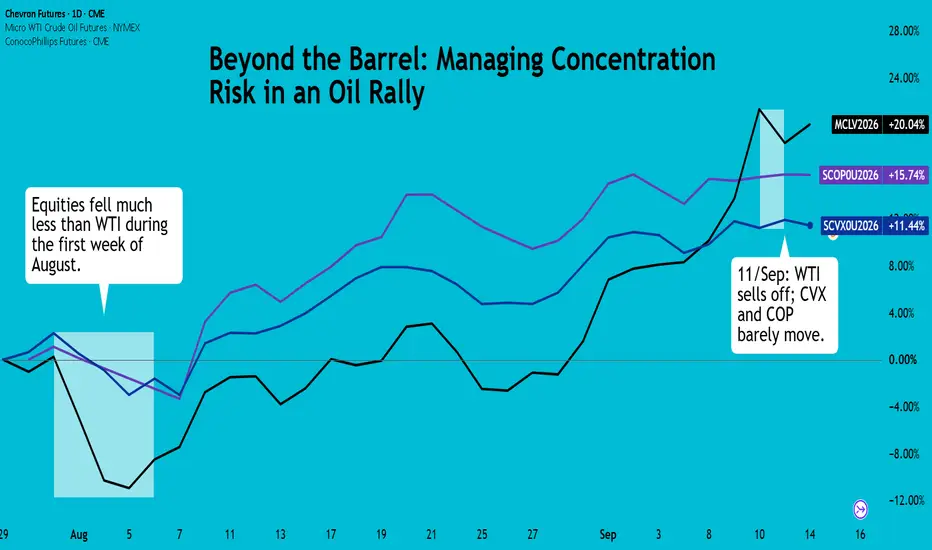
Crude’s move since August has been driven by a series of escalating flashpoints, not a single event. WTI gained nearly 30% from the start of August and crossed USD 100/bbl on 10/Sep.
Crude oil initially fell 7.7% during the first week of August as hopes of an Iran-Oman arrangement to ease Strait of Hormuz disruptions grew. Those hopes quickly faded, sending it up 5.1% on 10/Aug (Mon) as talks broke down. The push and pull continued through August, but the broader uptrend remained, with WTI ending the month up 2.2%.

A second front was already developing in the Red Sea. On 22/Jul, Houthi forces attacked two Saudi tankers near the Bab al Mandab, threatening another key oil shipping route. The attacks and subsequent Saudi-Houthi escalation added to concerns over regional supply security.
The decisive escalation came in early September, when the U.S. and Iran began directly targeting each other’s military and oil assets. On 5/Sep, the U.S. destroyed and disabled three Iranian oil tankers after the IRGC launched ballistic missiles at two U.S. Navy warships. On 8/Sep, the U.S. destroyed five more Iranian tankers after another missile attack on a U.S. warship.
WTI rose 3.25% on 9/Sep before surging another 6.7% on 10/Sep, reaching an intraday high of USD 104.04/barrel. Although WTI prices fell by 2.4% on 11/Sep, it closed the week 9.7% higher.
Major U.S. Oil Producers Uptrend is Measured
Oil majors rarely move one-for-one with crude, particularly during geopolitical spikes. Investors tend to discount the rally if they see it as temporary, while spending and returns are based on longer-term oil prices.

At the same time, inflation and rate concerns can offset some of the earnings benefit, leaving energy stocks well behind the commodity.
Why WTI Alone Isn't Always the Answer
WTI’s strength is also its weakness: with no business underneath it, the contract captures the full impact of a supply shock but can reverse just as quickly when sentiment changes. September’s move above USD 100 could unwind on the next headline.
Oil majors offer a different trade. Their earnings are diversified across crude, refining and chemicals, while buybacks and dividends provide additional support. As a result, their shares tend to move less sharply than WTI. That slower reaction also offers a useful signal: it reflects whether investors see higher oil prices as a lasting earnings shift or a temporary geopolitical spike.
The trade-off is clear: less upside torque than WTI, but greater downside protection and a better read on market conviction.
WTI Leads, but Equities Apply a Reality Check
CME’s Single Stock Futures suite launched on 27/Jul with 55 standard and 22 micro contracts covering more than 50 U.S. stocks. Of the oil names, the standard contracts cover ExxonMobil, Chevron and ConocoPhillips, while only Exxon is also available as a micro contract.
Trading nearly 23 hours a day allows investors to reprice these stocks continuously as geopolitical headlines unfold, rather than waiting for the equity market to reopen. CME has also launched 24/7 WTI futures, which we covered in our previous paper.

Source: ExxonMobil, Chevron, and ConocoPhillips
Exxon and Chevron may appear relatively insulated from crude because upstream contributes only around a quarter of revenue. But refining still depends on crude as a key input, so higher oil prices affect them through both feedstock costs and refining margins.

ConocoPhillips offers a cleaner read on crude with its entirely upstream business. Yet even it lagged significantly: WTI gained 25% while COP rose 15%. This suggests business mix is only part of the story. Equity risk appetite, doubts over the durability of the oil spike and company-specific factors also shape the response.
That same lag cuts both ways. On the downside, it can work in the investor’s favour: an instrument that captures less of the upside can also absorb less of the drawdown.
Historical Trade Example
By June, regional tensions appeared to be easing, but oil prices had already pulled back sharply from their April highs. An investor looking to stay exposed to the broader uptrend chose to split the position between Chevron and ConocoPhillips SSFs rather than take the full headline risk of crude oil.
Between mid-June and 10/Sep, the hypothetical trade would have generated a 14.19% gain on notional exposure, compared with 12.8% for WTI.
WTI fell 25.7% during the mid-June selloff, while Chevron and ConocoPhillips fell just 13.6% and 14.7%, respectively. The SSF position’s resilience during the June drawdown gave it enough of an advantage to remain ahead through the subsequent rally and outperform WTI by September.
Since SSFs on these names were not yet listed in June 2026, we use the underlying stocks’ closing prices as a proxy for SSF performance. Margin figures use current CME levels because historical SSF margin data is unavailable.
Contract details (as of entry):
Chevron SSF (SCVX0U2026): Initial margin per contract = USD 3,214; notional exposure at entry = 100 × USD 192 = USD 19,200
ConocoPhillips SSF (SCOP0U2026): Initial margin per contract = USD 2,063; notional exposure at entry = 100 × USD 118 = USD 11,800
Combined position: USD 5,277 in margin controlling USD 31,000 in notional exposure
Long CME Chevron SSF (SCVX0U2026)
Entry = USD 192
Exit = USD 216
PnL: 100 × (USD 216 – USD 192) = USD 2,400

Long CME ConocoPhillips SSF (SCOP0U2026)
Entry = USD 118
Exit = USD 138
PnL: 100 × (USD 138 – USD 118) = USD 2,000

Combined PnL = USD 2,400 + USD 2,000 = USD 4,400
That translates to an 83.4% return on the USD 5,277 margin committed, controlling USD 31,000 in combined notional exposure. WTI gained 12.8% over the same period, while the blended SSF position gained roughly 14.19% on a notional basis, outperforming the commodity itself while also carrying a materially shallower drawdown through the volatility in between.
This content is sponsored.
MARKET DATA
CME Real-time Market Data helps identify trading setups and more effectively express market views. If you have futures in your trading portfolio, you can check out on CME Group data plans available that suit your trading needs at tradingview.com/cme.
DISCLAIMER
This case study is for educational purposes only and does not constitute investment recommendations or advice. Nor are they used to promote any specific products, or services.
Trading or investment ideas cited here are for illustration only, as an integral part of a case study to demonstrate the fundamental concepts in risk management or trading under the market scenarios being discussed.
Crude oil initially fell 7.7% during the first week of August as hopes of an Iran-Oman arrangement to ease Strait of Hormuz disruptions grew. Those hopes quickly faded, sending it up 5.1% on 10/Aug (Mon) as talks broke down. The push and pull continued through August, but the broader uptrend remained, with WTI ending the month up 2.2%.
A second front was already developing in the Red Sea. On 22/Jul, Houthi forces attacked two Saudi tankers near the Bab al Mandab, threatening another key oil shipping route. The attacks and subsequent Saudi-Houthi escalation added to concerns over regional supply security.
The decisive escalation came in early September, when the U.S. and Iran began directly targeting each other’s military and oil assets. On 5/Sep, the U.S. destroyed and disabled three Iranian oil tankers after the IRGC launched ballistic missiles at two U.S. Navy warships. On 8/Sep, the U.S. destroyed five more Iranian tankers after another missile attack on a U.S. warship.
WTI rose 3.25% on 9/Sep before surging another 6.7% on 10/Sep, reaching an intraday high of USD 104.04/barrel. Although WTI prices fell by 2.4% on 11/Sep, it closed the week 9.7% higher.
Major U.S. Oil Producers Uptrend is Measured
Oil majors rarely move one-for-one with crude, particularly during geopolitical spikes. Investors tend to discount the rally if they see it as temporary, while spending and returns are based on longer-term oil prices.
At the same time, inflation and rate concerns can offset some of the earnings benefit, leaving energy stocks well behind the commodity.
Why WTI Alone Isn't Always the Answer
WTI’s strength is also its weakness: with no business underneath it, the contract captures the full impact of a supply shock but can reverse just as quickly when sentiment changes. September’s move above USD 100 could unwind on the next headline.
Oil majors offer a different trade. Their earnings are diversified across crude, refining and chemicals, while buybacks and dividends provide additional support. As a result, their shares tend to move less sharply than WTI. That slower reaction also offers a useful signal: it reflects whether investors see higher oil prices as a lasting earnings shift or a temporary geopolitical spike.
The trade-off is clear: less upside torque than WTI, but greater downside protection and a better read on market conviction.
WTI Leads, but Equities Apply a Reality Check
CME’s Single Stock Futures suite launched on 27/Jul with 55 standard and 22 micro contracts covering more than 50 U.S. stocks. Of the oil names, the standard contracts cover ExxonMobil, Chevron and ConocoPhillips, while only Exxon is also available as a micro contract.
Trading nearly 23 hours a day allows investors to reprice these stocks continuously as geopolitical headlines unfold, rather than waiting for the equity market to reopen. CME has also launched 24/7 WTI futures, which we covered in our previous paper.
Source: ExxonMobil, Chevron, and ConocoPhillips
Exxon and Chevron may appear relatively insulated from crude because upstream contributes only around a quarter of revenue. But refining still depends on crude as a key input, so higher oil prices affect them through both feedstock costs and refining margins.
ConocoPhillips offers a cleaner read on crude with its entirely upstream business. Yet even it lagged significantly: WTI gained 25% while COP rose 15%. This suggests business mix is only part of the story. Equity risk appetite, doubts over the durability of the oil spike and company-specific factors also shape the response.
That same lag cuts both ways. On the downside, it can work in the investor’s favour: an instrument that captures less of the upside can also absorb less of the drawdown.
Historical Trade Example
By June, regional tensions appeared to be easing, but oil prices had already pulled back sharply from their April highs. An investor looking to stay exposed to the broader uptrend chose to split the position between Chevron and ConocoPhillips SSFs rather than take the full headline risk of crude oil.
Between mid-June and 10/Sep, the hypothetical trade would have generated a 14.19% gain on notional exposure, compared with 12.8% for WTI.
WTI fell 25.7% during the mid-June selloff, while Chevron and ConocoPhillips fell just 13.6% and 14.7%, respectively. The SSF position’s resilience during the June drawdown gave it enough of an advantage to remain ahead through the subsequent rally and outperform WTI by September.
Since SSFs on these names were not yet listed in June 2026, we use the underlying stocks’ closing prices as a proxy for SSF performance. Margin figures use current CME levels because historical SSF margin data is unavailable.
Contract details (as of entry):
Chevron SSF (SCVX0U2026): Initial margin per contract = USD 3,214; notional exposure at entry = 100 × USD 192 = USD 19,200
ConocoPhillips SSF (SCOP0U2026): Initial margin per contract = USD 2,063; notional exposure at entry = 100 × USD 118 = USD 11,800
Combined position: USD 5,277 in margin controlling USD 31,000 in notional exposure
Long CME Chevron SSF (SCVX0U2026)
Entry = USD 192
Exit = USD 216
PnL: 100 × (USD 216 – USD 192) = USD 2,400
Long CME ConocoPhillips SSF (SCOP0U2026)
Entry = USD 118
Exit = USD 138
PnL: 100 × (USD 138 – USD 118) = USD 2,000
Combined PnL = USD 2,400 + USD 2,000 = USD 4,400
That translates to an 83.4% return on the USD 5,277 margin committed, controlling USD 31,000 in combined notional exposure. WTI gained 12.8% over the same period, while the blended SSF position gained roughly 14.19% on a notional basis, outperforming the commodity itself while also carrying a materially shallower drawdown through the volatility in between.
This content is sponsored.
MARKET DATA
CME Real-time Market Data helps identify trading setups and more effectively express market views. If you have futures in your trading portfolio, you can check out on CME Group data plans available that suit your trading needs at tradingview.com/cme.
DISCLAIMER
This case study is for educational purposes only and does not constitute investment recommendations or advice. Nor are they used to promote any specific products, or services.
Trading or investment ideas cited here are for illustration only, as an integral part of a case study to demonstrate the fundamental concepts in risk management or trading under the market scenarios being discussed.

Full Disclaimer - linktr.ee/mintfinance
Pernyataan Penyangkalan
Informasi dan publikasi ini tidak dimaksudkan, dan bukan merupakan, saran atau rekomendasi keuangan, investasi, trading, atau jenis lainnya yang diberikan atau didukung oleh TradingView. Baca selengkapnya di Ketentuan Penggunaan.
Full Disclaimer - linktr.ee/mintfinance
Pernyataan Penyangkalan
Informasi dan publikasi ini tidak dimaksudkan, dan bukan merupakan, saran atau rekomendasi keuangan, investasi, trading, atau jenis lainnya yang diberikan atau didukung oleh TradingView. Baca selengkapnya di Ketentuan Penggunaan.