
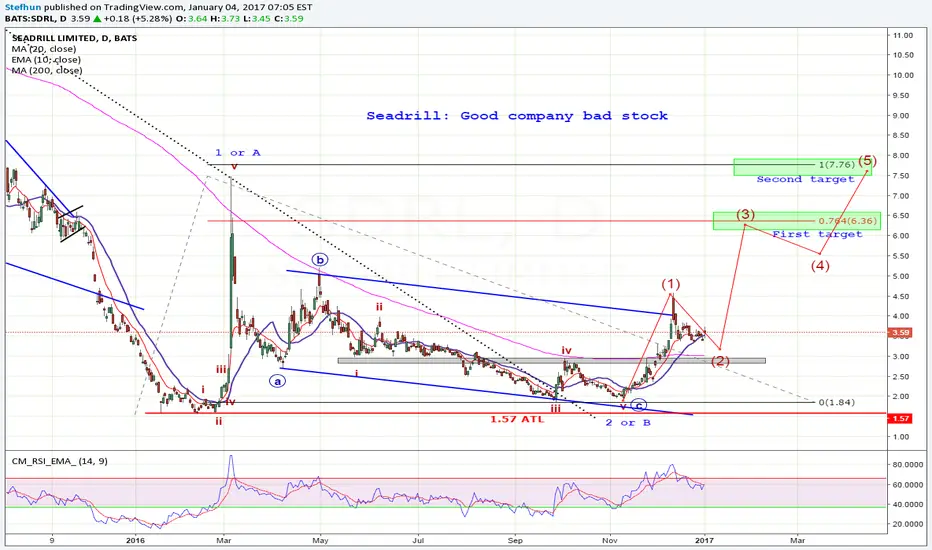
Stock went down from very high price to $1.57. Consolidation in progress.
This chart show that a good company can have a bad stock... I think this is a corrective movement after hit the $1.57 ATL
Flat to the upside... so, I do give a bigger probability to the ABC correction rather than impusle wave.
This is a daily chart but count based on weekly. Let's see how it will develop...

Pernyataan Penyangkalan
Informasi dan publikasi ini tidak dimaksudkan, dan bukan merupakan, saran atau rekomendasi keuangan, investasi, trading, atau jenis lainnya yang diberikan atau didukung oleh TradingView. Baca selengkapnya di Ketentuan Penggunaan.
Pernyataan Penyangkalan
Informasi dan publikasi ini tidak dimaksudkan, dan bukan merupakan, saran atau rekomendasi keuangan, investasi, trading, atau jenis lainnya yang diberikan atau didukung oleh TradingView. Baca selengkapnya di Ketentuan Penggunaan.