
Hello friends
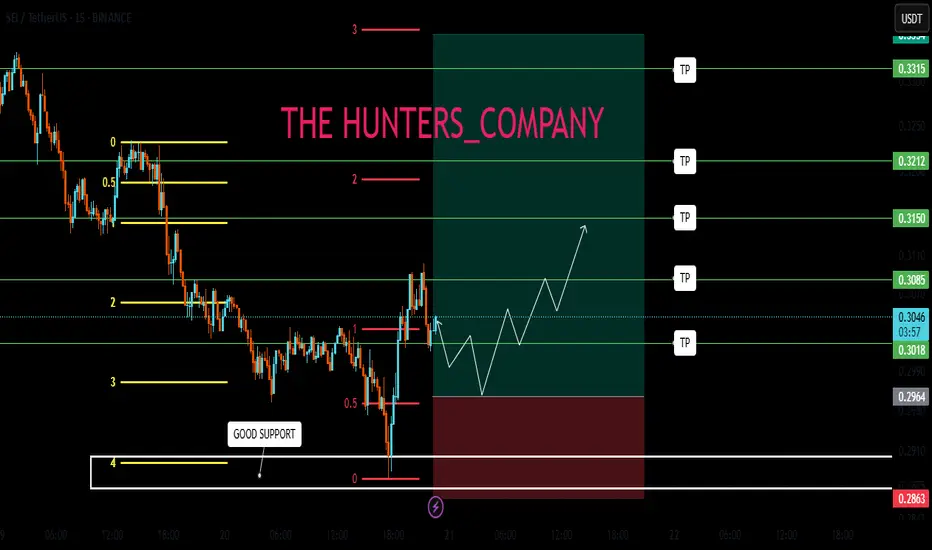
We drew a Fibonacci to get the support area and a Fibonacci for the resistance areas.
Now using support and resistance we can understand where the buy and sell points are.
In this price growth we wait for a pullback and in case of a pullback we can enter a trade in the specified area with risk and capital management and move with it until the specified resistances which are targets.
*Trade safely with us*
We drew a Fibonacci to get the support area and a Fibonacci for the resistance areas.
Now using support and resistance we can understand where the buy and sell points are.
In this price growth we wait for a pullback and in case of a pullback we can enter a trade in the specified area with risk and capital management and move with it until the specified resistances which are targets.
*Trade safely with us*
Trading ditutup: stop tercapai
Catatan
Well, friends, the price fell and went a little lower than the support area and was pumped and our targets were hit.Friends who had closed futures had their stop losses hit, but in the spot transaction, purchases were made at support and the targets were hit.
Good luck

Pernyataan Penyangkalan
Informasi dan publikasi ini tidak dimaksudkan, dan bukan merupakan, saran atau rekomendasi keuangan, investasi, trading, atau jenis lainnya yang diberikan atau didukung oleh TradingView. Baca selengkapnya di Ketentuan Penggunaan.
Pernyataan Penyangkalan
Informasi dan publikasi ini tidak dimaksudkan, dan bukan merupakan, saran atau rekomendasi keuangan, investasi, trading, atau jenis lainnya yang diberikan atau didukung oleh TradingView. Baca selengkapnya di Ketentuan Penggunaan.