Pembelian
SHOP 🐂 Bullish Potential Outlook 🐂
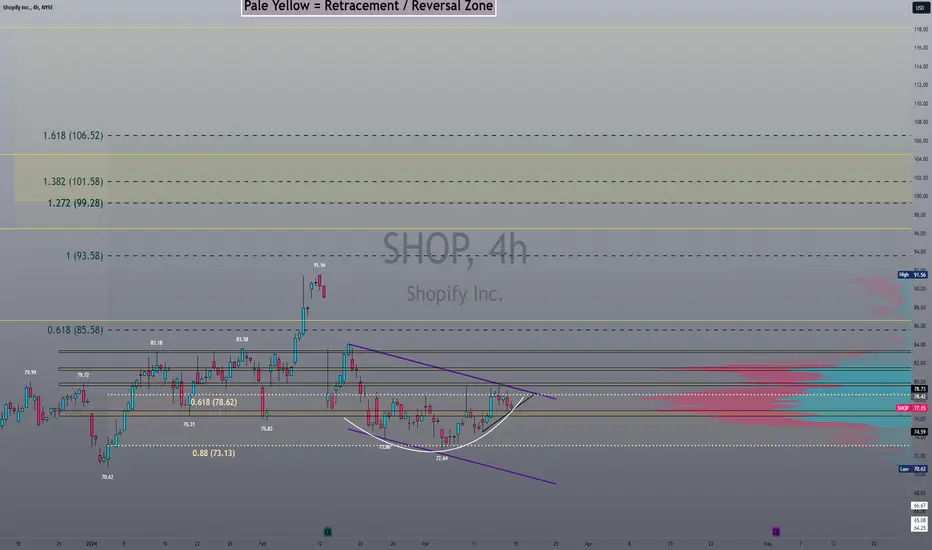
Holding SHOP 80C 3/28 @1.95 since 3/14, I'll update this with how it goes
Timeframes Used: The 15/30 min, 4hr, 5 Day

Above is the 30 minute time frame in which you can see the Bull flag aswelll as the rounding base forming

SHOP LEVELS
Just some fun levels lmao, I'll be happy w any profit obvi this is all speculation,
PnL based off of [url=https://optionstrat.com/bfJmdCrHPYGi]Option Strat
Technical Indicators
- Stochastic Oscillator left the overbought zone on March 14, 2024
- Entered Uptrend as Momentum indicator ascends above 0 level on Mar 13, 2024
- MACD Histogram turned positive on March 13, 2024
idk its funny if it works tho lol, Buy time or shares
I feel like the chart is straight forward, also my first chart in a long time
Will also do Higher time frame analysis and post it
Timeframes Used: The 15/30 min, 4hr, 5 Day
Above is the 30 minute time frame in which you can see the Bull flag aswelll as the rounding base forming
SHOP LEVELS
0.618 Extension: $85.58 (+11%) // 220%|$430
0.236 Retracement: $96.50 (+25%) // 753%%|$1,468
1 Extension: $93.58 (+21%) // 604%|$1,179
-0.236 Retracement: $96.50 (+25%) // 753%%|$1,468
At $100 (+30%) // 932%|$1,818
1.272 Extension: $99.28 (+29%) // 895%|$1,746
1.382 Extension: $101.58 (+29%) // 1013%|$1,975
-0.618 Retracement: $104.50(+35%) // 1163%|$2,267
1.618 Extension: $106.52 (+38%) // 1,266%|$2,469
-1.272 Retracement: $118.20(+29%) // 895%|$1,746
1.618 fib Retracement: $125.44 (+63%) // 2,237%|$4,361
Just some fun levels lmao, I'll be happy w any profit obvi this is all speculation,
PnL based off of [url=https://optionstrat.com/bfJmdCrHPYGi]Option Strat
Technical Indicators
- Stochastic Oscillator left the overbought zone on March 14, 2024
- Entered Uptrend as Momentum indicator ascends above 0 level on Mar 13, 2024
- MACD Histogram turned positive on March 13, 2024
idk its funny if it works tho lol, Buy time or shares
Catatan
30 Minute: 15 Minute:
5 minute:
Catatan
You can see within the 15 minute chart, We have a flag in a flag, at Golden zone in the micro, all timeframes seem to have synergyTrading ditutup secara manual
Sold for 53%Trade aktif
next week shop 82c @1.10
Made a server for anyone who wants to follow along; add me on discord @Gunvir if you have any questions or find my on twitter
I'm a full time student and this is a hobby.
(Its free to DM me a question lol)
discord.gg/luckycat
I'm a full time student and this is a hobby.
(Its free to DM me a question lol)
discord.gg/luckycat
Pernyataan Penyangkalan
Informasi dan publikasi ini tidak dimaksudkan, dan bukan merupakan, saran atau rekomendasi keuangan, investasi, trading, atau jenis lainnya yang diberikan atau didukung oleh TradingView. Baca selengkapnya di Ketentuan Penggunaan.