
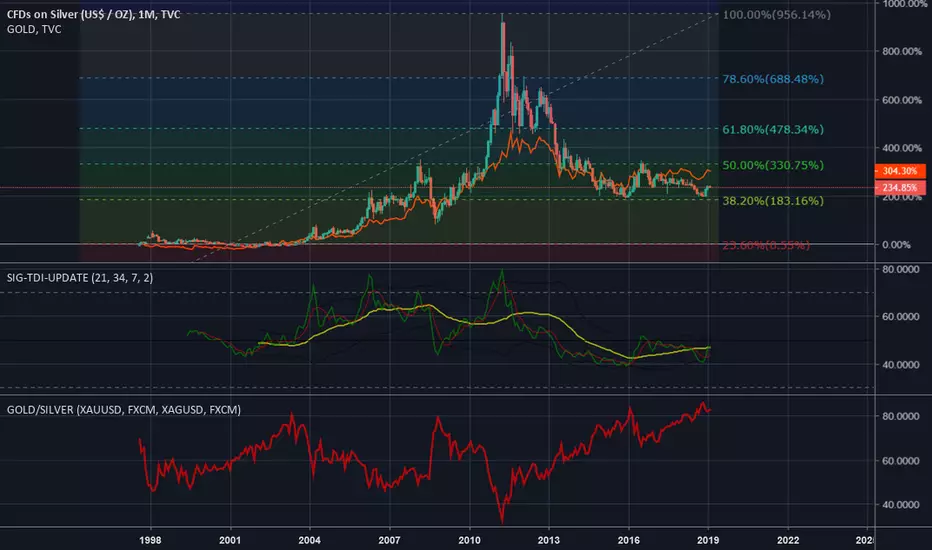
All long-looking indicators point to silver being undervalued vs gold. Top chart shows silver candlesticks vs gold red line as percentage returns since 1998. Middle indicator is the Trader's Dynamic Index (TDI) which holds a combination of moving average, volatility and momentum trends. Bottom indicator is the infamous Gold:Silver ratio.
Silver is sitting on top of the .382 fib level support shown in the chart, which is where the current cost of production resides around $14.75/oz. Low risk, high reward - this is a perfect setup for those interested in making an inflation play going toward negative rates, QE4 and the end of the petrodollar.
% Returns Analysis: Silver below Gold -> Silver undervalued
Fibonacci Level: Strong support at cost of production near $14.75/oz
TDI: Bullish divergence in formation
Gold/Silver ratio: 83:1 -> Silver undervalued
Silver is sitting on top of the .382 fib level support shown in the chart, which is where the current cost of production resides around $14.75/oz. Low risk, high reward - this is a perfect setup for those interested in making an inflation play going toward negative rates, QE4 and the end of the petrodollar.
% Returns Analysis: Silver below Gold -> Silver undervalued
Fibonacci Level: Strong support at cost of production near $14.75/oz
TDI: Bullish divergence in formation
Gold/Silver ratio: 83:1 -> Silver undervalued

Pernyataan Penyangkalan
Informasi dan publikasi ini tidak dimaksudkan, dan bukan merupakan, saran atau rekomendasi keuangan, investasi, trading, atau jenis lainnya yang diberikan atau didukung oleh TradingView. Baca selengkapnya di Ketentuan Penggunaan.
Pernyataan Penyangkalan
Informasi dan publikasi ini tidak dimaksudkan, dan bukan merupakan, saran atau rekomendasi keuangan, investasi, trading, atau jenis lainnya yang diberikan atau didukung oleh TradingView. Baca selengkapnya di Ketentuan Penggunaan.