
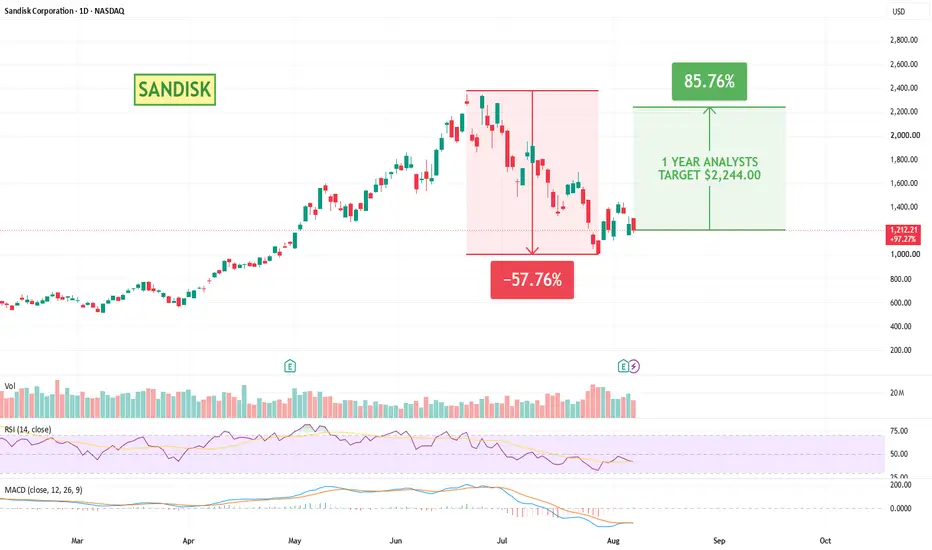
Sandisk has had an outstanding performance in the last year with a 2,786% gain even after the recent drop in price. It is a manufacturer of flash memory and data storage, producing technology that is used in data centres, enterprise storage, consumer devices, SSDs and other high-performance storage applications. Demand for AI infrastructure has become an increasingly important driver for the company.
The business momentum beneath it all is still strong; revenue in the fourth fiscal quarter hit $8.97 billion, considerably above what had been expected, and adjusted earnings amounted to $39.25 per share. Revenue from datacentre operations rose to about $3 billion as demand for storage related to AI has continued to grow. Sandisk is also securing longer-term agreements with its customers, having obtained eight contracts with six different customers covering almost $94 billion in expected revenue. The weak point was the guidance; the projected revenue for the following quarter, ranging from $10.3 billion to $10.8 billion, was only slightly below the higher levels that the market had anticipated, which in turn caused another negative reaction in the share price.
In fact, this is no longer the clean, well-controlled pullback that is normally linked with a strong momentum position. The price has dropped by about 58% from its most recent peak and the chart now indicates significant short-term trend damage, with sharp price movements and lower highs appearing through July. Volume increased at various points during the decline, especially around the late-July sell-off, indicating a great deal more aggressive selling than was observed during the earlier consolidation periods. The RSI has come back down to approximately 42 after momentarily reaching oversold levels and is now attempting to stabilise, while the MACD remains well below zero. The MACD lines are starting to level off, but there has still not been a clear bullish momentum shift.
What is now interesting is whether the recent low can turn into a base. Although the longer-term performance has remained remarkable, the momentum has to be restored before the chart begins to resemble the steady trending Sandisk from earlier in the year.
It has the potential to be worth watching if the trend keeps developing from this point.
Its back on my watch list - especially with a target 85% above the current price.
..................................................
PLEASE NOTE: Nothing I post is trading advice. All investing involves risk, and past performance doesn’t predict future results. Trends can and do end. I like to find stocks showing steady trends with some good gains, a recent pullback, and signs of renewed strength. I don’t necessarily hold positions in these. They are simply companies I find interesting at the time of posting. I’ll often revisit them within a week to see how they went and share any updates. If you enjoy these posts, please BOOST and FOLLOW ME.
..................................................
The business momentum beneath it all is still strong; revenue in the fourth fiscal quarter hit $8.97 billion, considerably above what had been expected, and adjusted earnings amounted to $39.25 per share. Revenue from datacentre operations rose to about $3 billion as demand for storage related to AI has continued to grow. Sandisk is also securing longer-term agreements with its customers, having obtained eight contracts with six different customers covering almost $94 billion in expected revenue. The weak point was the guidance; the projected revenue for the following quarter, ranging from $10.3 billion to $10.8 billion, was only slightly below the higher levels that the market had anticipated, which in turn caused another negative reaction in the share price.
In fact, this is no longer the clean, well-controlled pullback that is normally linked with a strong momentum position. The price has dropped by about 58% from its most recent peak and the chart now indicates significant short-term trend damage, with sharp price movements and lower highs appearing through July. Volume increased at various points during the decline, especially around the late-July sell-off, indicating a great deal more aggressive selling than was observed during the earlier consolidation periods. The RSI has come back down to approximately 42 after momentarily reaching oversold levels and is now attempting to stabilise, while the MACD remains well below zero. The MACD lines are starting to level off, but there has still not been a clear bullish momentum shift.
What is now interesting is whether the recent low can turn into a base. Although the longer-term performance has remained remarkable, the momentum has to be restored before the chart begins to resemble the steady trending Sandisk from earlier in the year.
It has the potential to be worth watching if the trend keeps developing from this point.
Its back on my watch list - especially with a target 85% above the current price.
..................................................
PLEASE NOTE: Nothing I post is trading advice. All investing involves risk, and past performance doesn’t predict future results. Trends can and do end. I like to find stocks showing steady trends with some good gains, a recent pullback, and signs of renewed strength. I don’t necessarily hold positions in these. They are simply companies I find interesting at the time of posting. I’ll often revisit them within a week to see how they went and share any updates. If you enjoy these posts, please BOOST and FOLLOW ME.
..................................................

NOT TRADING ADVICE. ALWAYS DO YOUR OWN RESEARCH.
MY CUSTOM INDICATOR TO FIND TRAILING STOPS: SuperTrail.io
MY YOUTUBE CHANNEL WITH TRADINGVIEW TIPS: YouTube.com/@zAngus
MY CUSTOM INDICATOR TO FIND TRAILING STOPS: SuperTrail.io
MY YOUTUBE CHANNEL WITH TRADINGVIEW TIPS: YouTube.com/@zAngus
Pernyataan Penyangkalan
Informasi dan publikasi ini tidak dimaksudkan, dan bukan merupakan, saran atau rekomendasi keuangan, investasi, trading, atau jenis lainnya yang diberikan atau didukung oleh TradingView. Baca selengkapnya di Ketentuan Penggunaan.
NOT TRADING ADVICE. ALWAYS DO YOUR OWN RESEARCH.
MY CUSTOM INDICATOR TO FIND TRAILING STOPS: SuperTrail.io
MY YOUTUBE CHANNEL WITH TRADINGVIEW TIPS: YouTube.com/@zAngus
MY CUSTOM INDICATOR TO FIND TRAILING STOPS: SuperTrail.io
MY YOUTUBE CHANNEL WITH TRADINGVIEW TIPS: YouTube.com/@zAngus
Pernyataan Penyangkalan
Informasi dan publikasi ini tidak dimaksudkan, dan bukan merupakan, saran atau rekomendasi keuangan, investasi, trading, atau jenis lainnya yang diberikan atau didukung oleh TradingView. Baca selengkapnya di Ketentuan Penggunaan.