
Technical Analysis and Outlook:
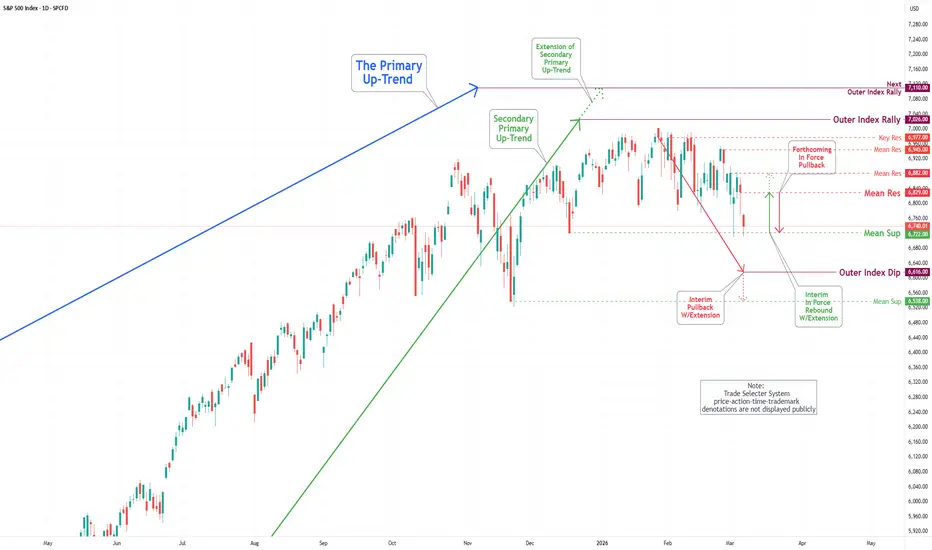
The S&P 500 Index experienced a substantial decline this week, decreasing from the inverse Mean Support level of 6,877 to the Mean Support level of 6,722.
In the forthcoming trading session, the S&P 500 Index is expected to demonstrate a recovery by retesting the Mean Resistance level of 6,829 and possibly extending to the subsequent Mean Resistance level of 6,882.
Nonetheless, one of these levels indicates a significant likelihood of a gradual and steady-to-lower decline toward the Mean Support at 6,722, which may ultimately lead to the completion of the Outer Index Dip at 6,616.
The S&P 500 Index experienced a substantial decline this week, decreasing from the inverse Mean Support level of 6,877 to the Mean Support level of 6,722.
In the forthcoming trading session, the S&P 500 Index is expected to demonstrate a recovery by retesting the Mean Resistance level of 6,829 and possibly extending to the subsequent Mean Resistance level of 6,882.
Nonetheless, one of these levels indicates a significant likelihood of a gradual and steady-to-lower decline toward the Mean Support at 6,722, which may ultimately lead to the completion of the Outer Index Dip at 6,616.

Publikasi terkait
Pernyataan Penyangkalan
Informasi dan publikasi ini tidak dimaksudkan, dan bukan merupakan, saran atau rekomendasi keuangan, investasi, trading, atau jenis lainnya yang diberikan atau didukung oleh TradingView. Baca selengkapnya di Ketentuan Penggunaan.
Publikasi terkait
Pernyataan Penyangkalan
Informasi dan publikasi ini tidak dimaksudkan, dan bukan merupakan, saran atau rekomendasi keuangan, investasi, trading, atau jenis lainnya yang diberikan atau didukung oleh TradingView. Baca selengkapnya di Ketentuan Penggunaan.