
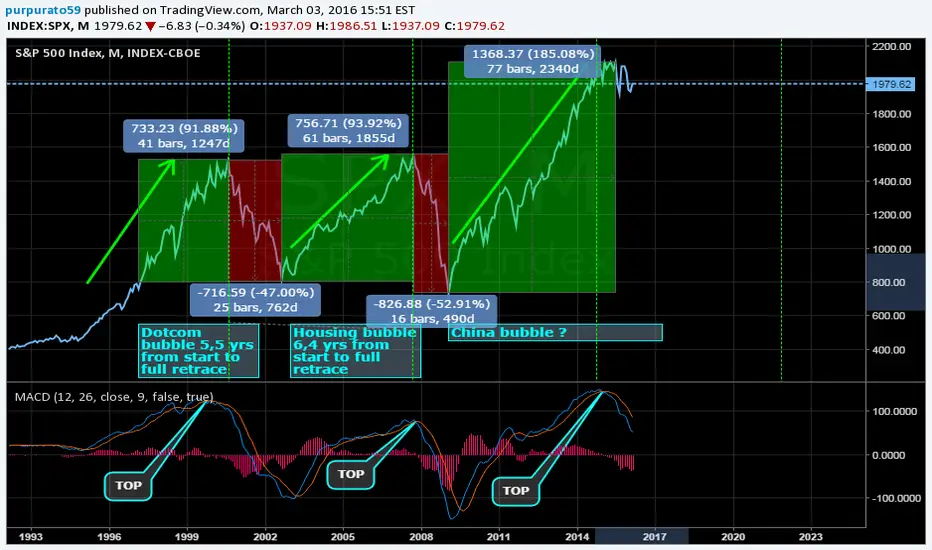
This is a long term historic analysis of SPX showing the length of the bull market and its following decline. The MACD in this case is quite acurate to identify this long term tops. Following that we are already now on a long term bear market and the last top was around februrary 2015. It is not clear how long is it going to take to fully retrace as we did on the previous two cycles. The green dotted lines are traced with last two tops and they are useful to identify the present top, and following that, bottom for this cycle could be placed in Q1 2018.

Publikasi terkait
Pernyataan Penyangkalan
Informasi dan publikasi ini tidak dimaksudkan, dan bukan merupakan, saran atau rekomendasi keuangan, investasi, trading, atau jenis lainnya yang diberikan atau didukung oleh TradingView. Baca selengkapnya di Ketentuan Penggunaan.
Publikasi terkait
Pernyataan Penyangkalan
Informasi dan publikasi ini tidak dimaksudkan, dan bukan merupakan, saran atau rekomendasi keuangan, investasi, trading, atau jenis lainnya yang diberikan atau didukung oleh TradingView. Baca selengkapnya di Ketentuan Penggunaan.