
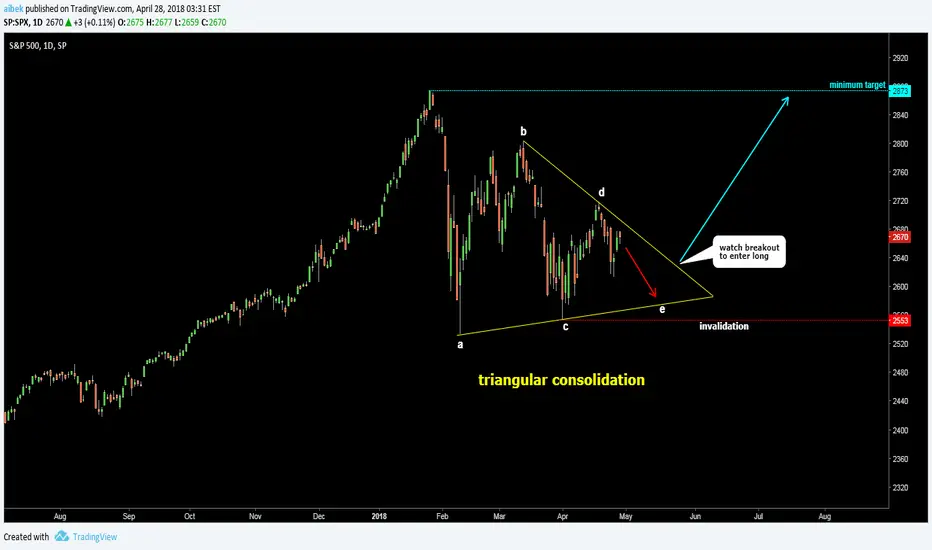
Current consolidation in S&P 500 could shape a triangular pattern ABCDE.
The drop started on 18th of April shouldn't exceed the low of the wave C at the 2553.
The breakout of triangle could be a trigger to enter long.
Some riskier people could buy on the dip to the downside of Triangle but it would be a mere guessing
as the WXY main count could still unfold successfully (related idea).
The minimum target area starts at the former top at the 2873.
Catatan
It looks like the pattern develops in line with the triangle model.The wave "E" retraced the wave "D" very deep down to 78.6% and that is a healthy sign.
Now we see how the index is approaching the trendline resistance (B-D line).
Watch for the breakout to enter long.
Catatan
Breakup above wave D beyond the 2718 makes this idea valid and dominantCatatan
Catatan
Despite that Nasdaq is rocketing higher the S&P 500 and Dow are lagging and it makes me think of one old chart I posted earlier for the S&P 500 in February tradingview.com/chart/SPX/hYG5NSSj-S-P-500-Big-map-with-current-correction/.It was simplified as the correction just started and in reality it is not an ABC it could be a larger WXY correction but the blue zigzag there shows the path.
Catatan
Here is an updated chart for the current ideaMACD shows bearish divergence and I would recommend to book profit here as price couldn't overcome the 2802 the crucial resistance and there is a chance of a complicated correction ahead and I will prepare the separate post later
Trading ditutup secara manual
Better take profit as I don't like Dow and AAPL chart structure.Catatan
Eventually hit the target and went beyond
Publikasi terkait
Pernyataan Penyangkalan
Informasi dan publikasi ini tidak dimaksudkan, dan bukan merupakan, saran atau rekomendasi keuangan, investasi, trading, atau jenis lainnya yang diberikan atau didukung oleh TradingView. Baca selengkapnya di Ketentuan Penggunaan.
Publikasi terkait
Pernyataan Penyangkalan
Informasi dan publikasi ini tidak dimaksudkan, dan bukan merupakan, saran atau rekomendasi keuangan, investasi, trading, atau jenis lainnya yang diberikan atau didukung oleh TradingView. Baca selengkapnya di Ketentuan Penggunaan.