
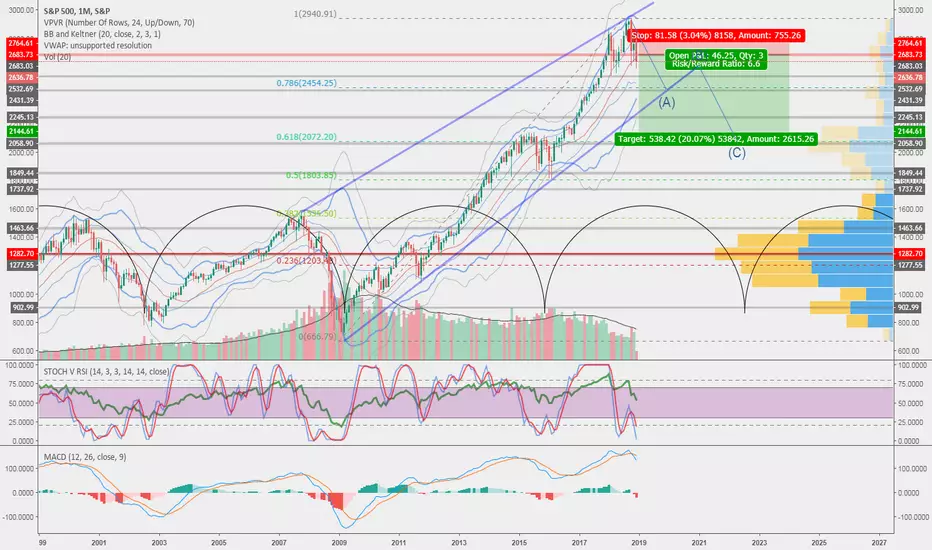
S&P500 six months chart shows overbought level and start of correction. Five growing Elliot waves accomplished and ABC pattern should land us to 2100 support. In worse case it may fall down to 1850 as well.

Perfect short position was above but price still may hit 2700 before finally going down.
Perfect short position was above but price still may hit 2700 before finally going down.
Catatan
Oh shit, month chart. Too large timeframe =))) Anyway, now we all know that most probably America is going down... or someone else is risingCatatan
Anyway, Dow Jones says the same. Either a jump before even stronger pump (in months timeframe, considering previous took two years), or a fall, as I said.
FREE telegram channels:
Main crypto channel - t.me/WiseAnalyze
Crypto chat - t.me/WiseAnalyzeChat
Crypto watchlist - t.me/wiseanalize
Main crypto channel - t.me/WiseAnalyze
Crypto chat - t.me/WiseAnalyzeChat
Crypto watchlist - t.me/wiseanalize
Pernyataan Penyangkalan
Informasi dan publikasi ini tidak dimaksudkan, dan bukan merupakan, saran atau rekomendasi keuangan, investasi, trading, atau jenis lainnya yang diberikan atau didukung oleh TradingView. Baca selengkapnya di Ketentuan Penggunaan.
FREE telegram channels:
Main crypto channel - t.me/WiseAnalyze
Crypto chat - t.me/WiseAnalyzeChat
Crypto watchlist - t.me/wiseanalize
Main crypto channel - t.me/WiseAnalyze
Crypto chat - t.me/WiseAnalyzeChat
Crypto watchlist - t.me/wiseanalize
Pernyataan Penyangkalan
Informasi dan publikasi ini tidak dimaksudkan, dan bukan merupakan, saran atau rekomendasi keuangan, investasi, trading, atau jenis lainnya yang diberikan atau didukung oleh TradingView. Baca selengkapnya di Ketentuan Penggunaan.