S&P 500 ( SPX) Daily Update: Index Remains Locked in Symmetrical Triangle – Tactical Range-Playbook Rules Until Breakout Confirmation
### 🇺🇸 S&P 500 Index (SPX) Mid-Weight Macro Brief (Ref: SPX_2026-07-06_10-22-10.png)
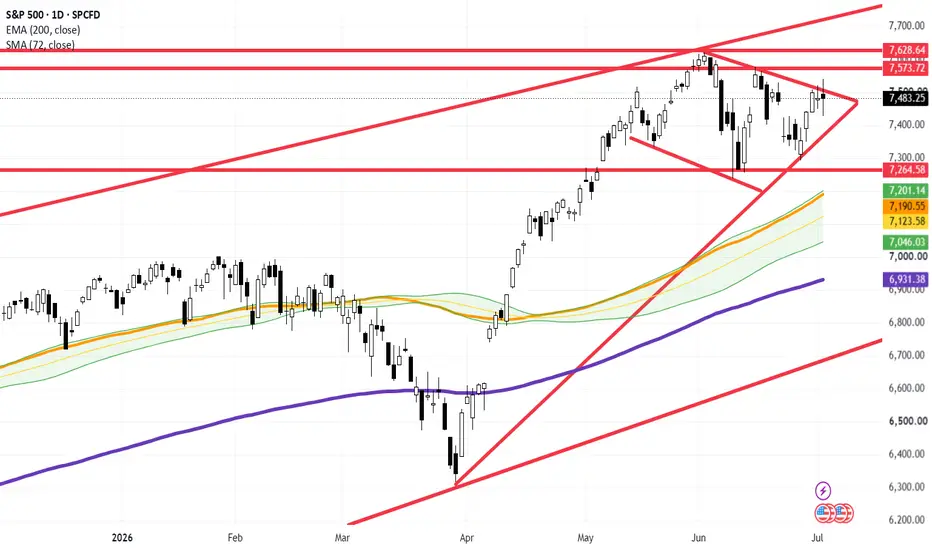
We are releasing an essential structural update on the S&P 500 Index (SPX) on the Daily (1D) time matrix. Following a brief breakout attempt last week, aggregate institutional order flow failed to secure structural acceptance above the local descending resistance line, pulling price action back into structural equilibrium.
The benchmark index starts the week flat, trading at **7,483.25 (+0.00%)**, exactly inside the heart of a prolonged volatility compression model.
---
### 🔍 Technical Geometry & Dual Macro Roadmap:
The index continues to coil tightly within a mature **Symmetrical Triangle** pattern (bounded by the converging red diagonal lines of trend). Until a clean daily close materializes outside of these key boundaries, we map out two definitive paths for directional expansion:
1. **The Bullish Expansion Scenario (~7,621+):** To trigger a fresh institutional leg of price discovery, buyers must push past the current dynamic compression ceiling and invalidate the immediate horizontal supply stack at **7,573.72**. This clear breakout will open the technical highway to re-test and breach the absolute multi-month high around the **7,621 – 7,628.64** corridor.
2. **The Mean-Reversion Corrective Scenario (~7,237):** Conversely, if sellers reject the price at the upper boundary and break the lower ascending trendline, a healthy mean-reversion phase will be triggered. This corrective slide will target the strong **7,237 – 7,264.58 horizontal support baseline**, aligning beautifully with the secondary dynamic defense band of our rising **72-period SMA (orange line sitting at 7,190.55)**.
---
### 🎯 Current Tactical Playbook: Range Mechanics Only
Because the index is locked inside a narrowing structural congestion window, chasing breakouts inside the triangle yields highly unfavorable win-probability metrics.
Our systematic framework strictly enforces range-bound rules for the moment:
* **Buy-Side Accumulation:** Executing long exposure exclusively near the lower dynamic support trendline of the triangle, with tight invalidation parameters.
* **Sell-Side Distribution:** Scaling out longs or looking for localized short setups as price tags the descending structural resistance ceiling.
We remain patient, respecting the triangle borders until institutional volume confirms a structural resolution.
---
📊 **ChartPro Data**
*US Benchmark Architecture, Symmetrical Squeeze Models & Systematic Range-Trading Systems.*
⚠️ **Disclaimer:** For educational and informational purposes only. This active market study represents a personal trading framework and does not constitute financial or investment advice.
SPX) Daily Update: Index Remains Locked in Symmetrical Triangle – Tactical Range-Playbook Rules Until Breakout Confirmation### 🇺🇸 S&P 500 Index (
SPX) Mid-Weight Macro Brief (Ref: SPX_2026-07-06_10-22-10.png)We are releasing an essential structural update on the S&P 500 Index (
SPX) on the Daily (1D) time matrix. Following a brief breakout attempt last week, aggregate institutional order flow failed to secure structural acceptance above the local descending resistance line, pulling price action back into structural equilibrium.The benchmark index starts the week flat, trading at **7,483.25 (+0.00%)**, exactly inside the heart of a prolonged volatility compression model.
---
### 🔍 Technical Geometry & Dual Macro Roadmap:
The index continues to coil tightly within a mature **Symmetrical Triangle** pattern (bounded by the converging red diagonal lines of trend). Until a clean daily close materializes outside of these key boundaries, we map out two definitive paths for directional expansion:
1. **The Bullish Expansion Scenario (~7,621+):** To trigger a fresh institutional leg of price discovery, buyers must push past the current dynamic compression ceiling and invalidate the immediate horizontal supply stack at **7,573.72**. This clear breakout will open the technical highway to re-test and breach the absolute multi-month high around the **7,621 – 7,628.64** corridor.
2. **The Mean-Reversion Corrective Scenario (~7,237):** Conversely, if sellers reject the price at the upper boundary and break the lower ascending trendline, a healthy mean-reversion phase will be triggered. This corrective slide will target the strong **7,237 – 7,264.58 horizontal support baseline**, aligning beautifully with the secondary dynamic defense band of our rising **72-period SMA (orange line sitting at 7,190.55)**.
---
### 🎯 Current Tactical Playbook: Range Mechanics Only
Because the index is locked inside a narrowing structural congestion window, chasing breakouts inside the triangle yields highly unfavorable win-probability metrics.
Our systematic framework strictly enforces range-bound rules for the moment:
* **Buy-Side Accumulation:** Executing long exposure exclusively near the lower dynamic support trendline of the triangle, with tight invalidation parameters.
* **Sell-Side Distribution:** Scaling out longs or looking for localized short setups as price tags the descending structural resistance ceiling.
We remain patient, respecting the triangle borders until institutional volume confirms a structural resolution.
---
📊 **ChartPro Data**
*US Benchmark Architecture, Symmetrical Squeeze Models & Systematic Range-Trading Systems.*
⚠️ **Disclaimer:** For educational and informational purposes only. This active market study represents a personal trading framework and does not constitute financial or investment advice.

Pernyataan Penyangkalan
Informasi dan publikasi ini tidak dimaksudkan, dan bukan merupakan, saran atau rekomendasi keuangan, investasi, trading, atau jenis lainnya yang diberikan atau didukung oleh TradingView. Baca selengkapnya di Ketentuan Penggunaan.
Pernyataan Penyangkalan
Informasi dan publikasi ini tidak dimaksudkan, dan bukan merupakan, saran atau rekomendasi keuangan, investasi, trading, atau jenis lainnya yang diberikan atau didukung oleh TradingView. Baca selengkapnya di Ketentuan Penggunaan.