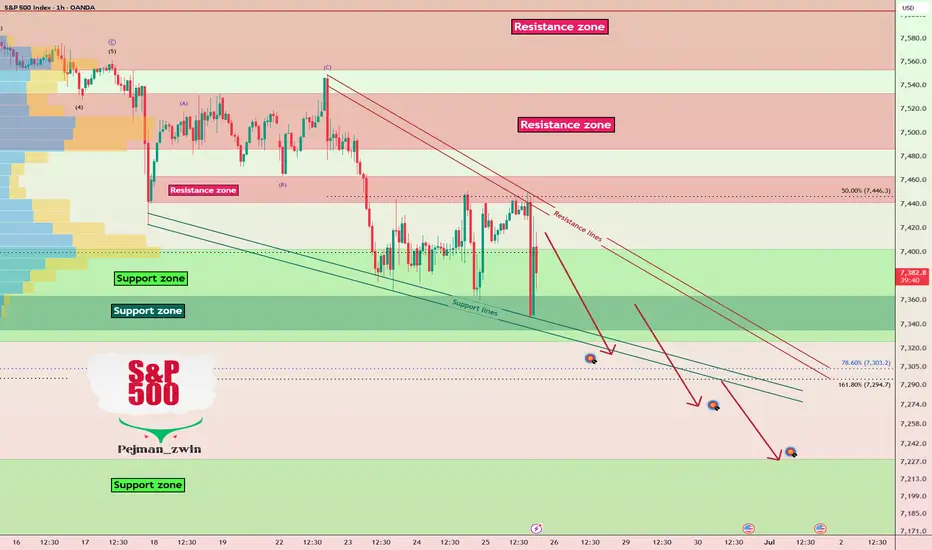
The S&P 500 index( SPX500) is currently moving within a support zone($7,402-$7,326), attempting to break through this area. Considering today’s U.S. economic data, it seems likely that we might see a break of this support zone($7,402-$7,326).
From an Elliott Wave standpoint, the downward waves in the S&P 500 seem to continue.
I expect the S&P 500 to break the support zone($7,402-$7,326) in the coming hours and potentially drop at least to the support lines around $4,311. If the downward momentum is stronger, we can expect even lower levels.
First Target: $7,411
Second Target: $7,273
Third Target: $7,235
Stop Loss(SL): $7,474(Worst)
Note: Since Bitcoin(
 BTCUSDT) is correlated with this index, a decline in the S&P 500 could also cause declines in cryptocurrency markets, particularly Bitcoin.
What’s your view on the S&P 500? Do you think it can break the support zone and fall further, or should we expect a rebound?
💡 Please respect each other's opinions and express agreement or disagreement politely.
📌 S&P 500 Index Analyze (SPX500USD), 1-hour time frame.
🛑 Always set a Stop Loss(SL) for every position you open.
✅ This is just my idea; I’d love to see your thoughts too!
🔥 If you find it helpful, please BOOST this post and share it with your friends.
SPX500) is currently moving within a support zone($7,402-$7,326), attempting to break through this area. Considering today’s U.S. economic data, it seems likely that we might see a break of this support zone($7,402-$7,326).From an Elliott Wave standpoint, the downward waves in the S&P 500 seem to continue.
I expect the S&P 500 to break the support zone($7,402-$7,326) in the coming hours and potentially drop at least to the support lines around $4,311. If the downward momentum is stronger, we can expect even lower levels.
First Target: $7,411
Second Target: $7,273
Third Target: $7,235
Stop Loss(SL): $7,474(Worst)
Note: Since Bitcoin(
BTCUSDT) is correlated with this index, a decline in the S&P 500 could also cause declines in cryptocurrency markets, particularly Bitcoin.What’s your view on the S&P 500? Do you think it can break the support zone and fall further, or should we expect a rebound?
💡 Please respect each other's opinions and express agreement or disagreement politely.
📌 S&P 500 Index Analyze (SPX500USD), 1-hour time frame.
🛑 Always set a Stop Loss(SL) for every position you open.
✅ This is just my idea; I’d love to see your thoughts too!
🔥 If you find it helpful, please BOOST this post and share it with your friends.
Trade aktif
Trading ditutup: target tercapai
First Target Done

🚀 Up to 75% Trading Fee Rebates Across 20+ Exchanges:
🤖 t.me/Protrader365bot
-----
🎁 Free VIP Forex and Crypto Signals, please visit:
🔗 t.me/ProTrader_365
🤖 t.me/Protrader365bot
-----
🎁 Free VIP Forex and Crypto Signals, please visit:
🔗 t.me/ProTrader_365
Publikasi terkait
Pernyataan Penyangkalan
Informasi dan publikasi ini tidak dimaksudkan, dan bukan merupakan, saran atau rekomendasi keuangan, investasi, trading, atau jenis lainnya yang diberikan atau didukung oleh TradingView. Baca selengkapnya di Ketentuan Penggunaan.
🚀 Up to 75% Trading Fee Rebates Across 20+ Exchanges:
🤖 t.me/Protrader365bot
-----
🎁 Free VIP Forex and Crypto Signals, please visit:
🔗 t.me/ProTrader_365
🤖 t.me/Protrader365bot
-----
🎁 Free VIP Forex and Crypto Signals, please visit:
🔗 t.me/ProTrader_365
Publikasi terkait
Pernyataan Penyangkalan
Informasi dan publikasi ini tidak dimaksudkan, dan bukan merupakan, saran atau rekomendasi keuangan, investasi, trading, atau jenis lainnya yang diberikan atau didukung oleh TradingView. Baca selengkapnya di Ketentuan Penggunaan.