As I expected in the previous idea, the S&P 500 index( SPX500) started to decline and reached all of its targets.
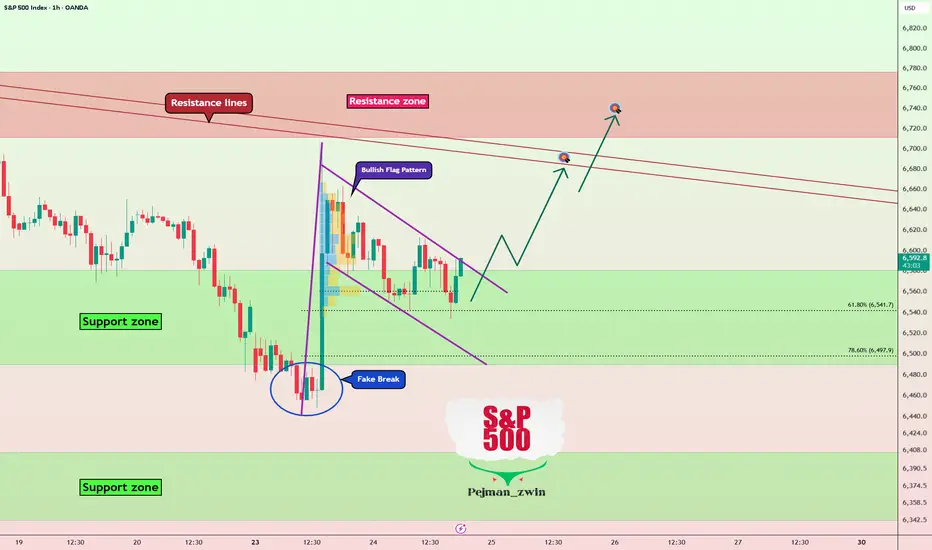
Currently, the S&P 500 is moving near a support zone($6,581-$6,489), and a fake break below it has formed. However, after this fake break, the momentum moved in the opposite direction.
From a classic technical analysis perspective, on the 1-hour timeframe, it looks like a bullish flag pattern is forming on the S&P 500 index.
I expect that in the next few hours, the S&P 500 will start to rise again with increased volume and reach at least $6,671.
First Target: $6,671
Second Target: resistance zone($6,777-$6,711)
Stop Loss(SL): $6,491
Points may shift as the market evolves
What do you think about the S&P 500 index and the U.S. stock market?
Note: Due to Bitcoin's(
 BTCUSDT) high correlation with the S&P 500 index these days, if the index rises again, it could drive Bitcoin's price higher.
Note: In case of escalating Middle East tensions in the coming days, we might see a sudden drop in the S&P 500. Thus, managing capital is crucial, especially these days when markets fluctuate more on news and statements.
💡 Please respect each other's opinions and express agreement or disagreement politely.
📌 S&P 500 Index Analyze (SPX500USD), 1-hour time frame.
🛑 Always set a Stop Loss(SL) for every position you open.
✅ This is just my idea; I’d love to see your thoughts too!
🔥 If you find it helpful, please BOOST this post and share it with your friends.
SPX500) started to decline and reached all of its targets.Currently, the S&P 500 is moving near a support zone($6,581-$6,489), and a fake break below it has formed. However, after this fake break, the momentum moved in the opposite direction.
From a classic technical analysis perspective, on the 1-hour timeframe, it looks like a bullish flag pattern is forming on the S&P 500 index.
I expect that in the next few hours, the S&P 500 will start to rise again with increased volume and reach at least $6,671.
First Target: $6,671
Second Target: resistance zone($6,777-$6,711)
Stop Loss(SL): $6,491
Points may shift as the market evolves
What do you think about the S&P 500 index and the U.S. stock market?
Note: Due to Bitcoin's(
BTCUSDT) high correlation with the S&P 500 index these days, if the index rises again, it could drive Bitcoin's price higher.Note: In case of escalating Middle East tensions in the coming days, we might see a sudden drop in the S&P 500. Thus, managing capital is crucial, especially these days when markets fluctuate more on news and statements.
💡 Please respect each other's opinions and express agreement or disagreement politely.
📌 S&P 500 Index Analyze (SPX500USD), 1-hour time frame.
🛑 Always set a Stop Loss(SL) for every position you open.
✅ This is just my idea; I’d love to see your thoughts too!
🔥 If you find it helpful, please BOOST this post and share it with your friends.
Trade aktif
Trade was activated Trading ditutup: stop tercapai
Stop Loss was touched
🚀 Up to 75% Trading Fee Rebates Across 20+ Exchanges:
🤖 t.me/Protrader365bot
-----
🎁 Free VIP Forex and Crypto Signals, please visit:
🔗 t.me/ProTrader_365
🤖 t.me/Protrader365bot
-----
🎁 Free VIP Forex and Crypto Signals, please visit:
🔗 t.me/ProTrader_365
Publikasi terkait
Pernyataan Penyangkalan
Informasi dan publikasi ini tidak dimaksudkan, dan bukan merupakan, saran atau rekomendasi keuangan, investasi, trading, atau jenis lainnya yang diberikan atau didukung oleh TradingView. Baca selengkapnya di Ketentuan Penggunaan.
🚀 Up to 75% Trading Fee Rebates Across 20+ Exchanges:
🤖 t.me/Protrader365bot
-----
🎁 Free VIP Forex and Crypto Signals, please visit:
🔗 t.me/ProTrader_365
🤖 t.me/Protrader365bot
-----
🎁 Free VIP Forex and Crypto Signals, please visit:
🔗 t.me/ProTrader_365
Publikasi terkait
Pernyataan Penyangkalan
Informasi dan publikasi ini tidak dimaksudkan, dan bukan merupakan, saran atau rekomendasi keuangan, investasi, trading, atau jenis lainnya yang diberikan atau didukung oleh TradingView. Baca selengkapnya di Ketentuan Penggunaan.