
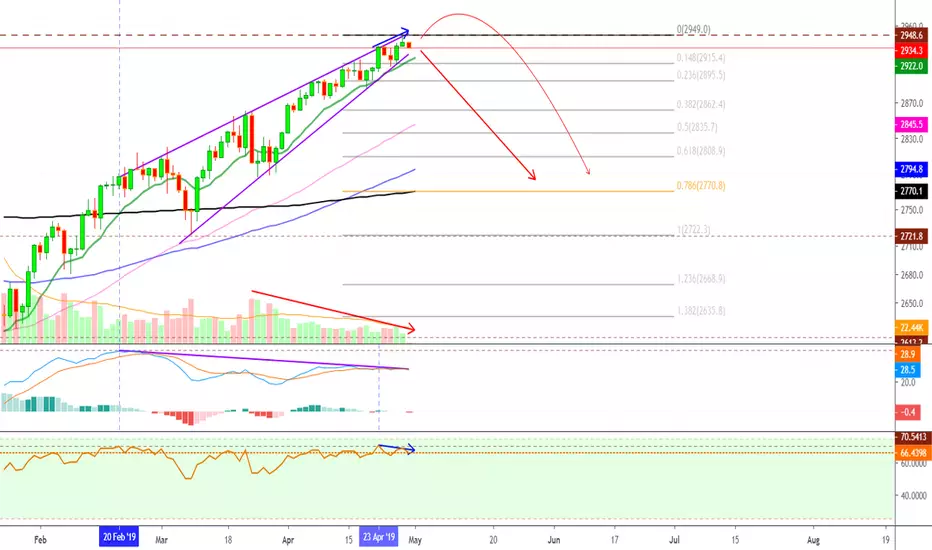
The S&P 500 Index (SPX500USD) has reached a new all-time high while weakness signals continue to pop up all over the place.
The MACD continues descending and going lower:
Bearish divergence is now showing on the RSI from the 23rd to the 29th April, marked with a blue arrow...
How much longer can this go?
Let us know in the comments section below!
We are still expecting for this index to drop according to the signals just mentioned.
Thanks a lot for reading.
This is Alan Masters.
Namaste.
The MACD continues descending and going lower:
Bearish divergence is now showing on the RSI from the 23rd to the 29th April, marked with a blue arrow...
How much longer can this go?
Let us know in the comments section below!
We are still expecting for this index to drop according to the signals just mentioned.
Thanks a lot for reading.
This is Alan Masters.
Namaste.
Catatan
Apple Inc (AAPL)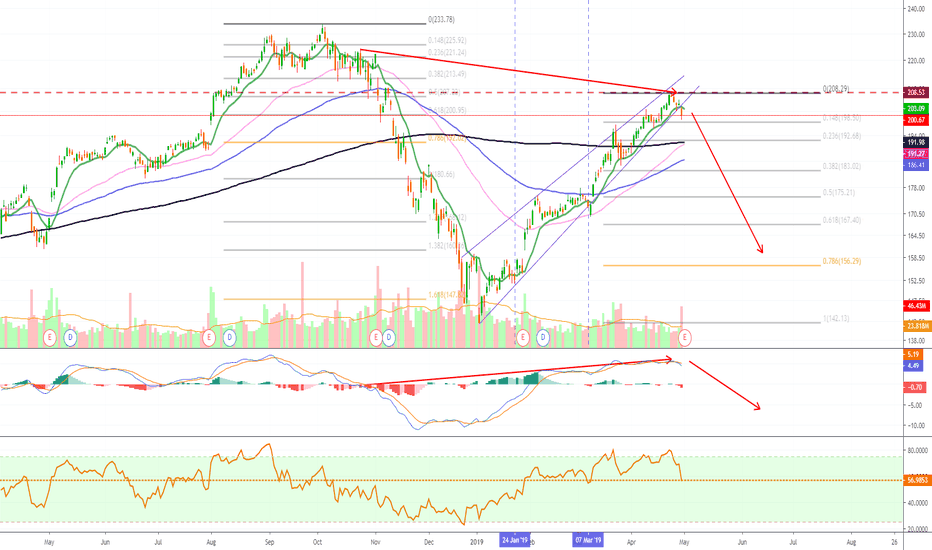
Catatan
Is this it? Only time will tell: Catatan
Latest update: 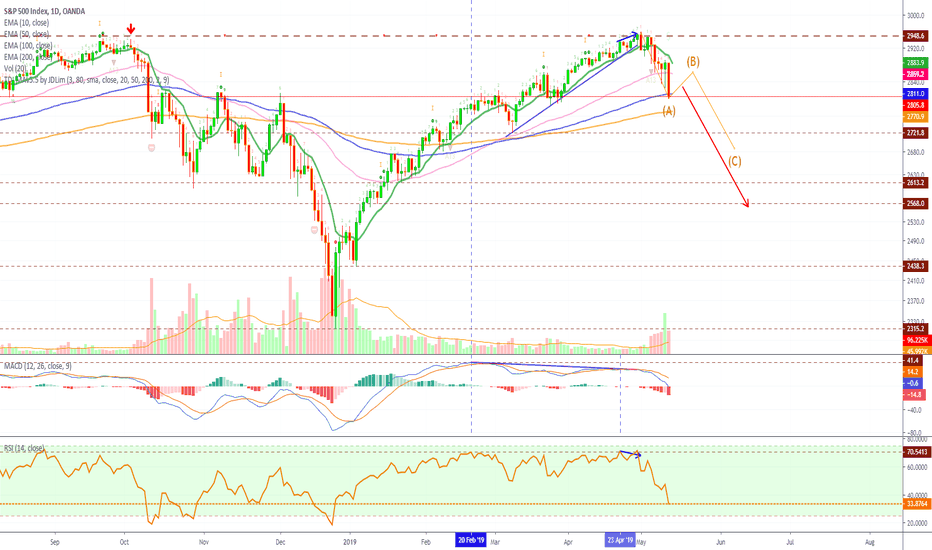
Catatan
More updates:DJI
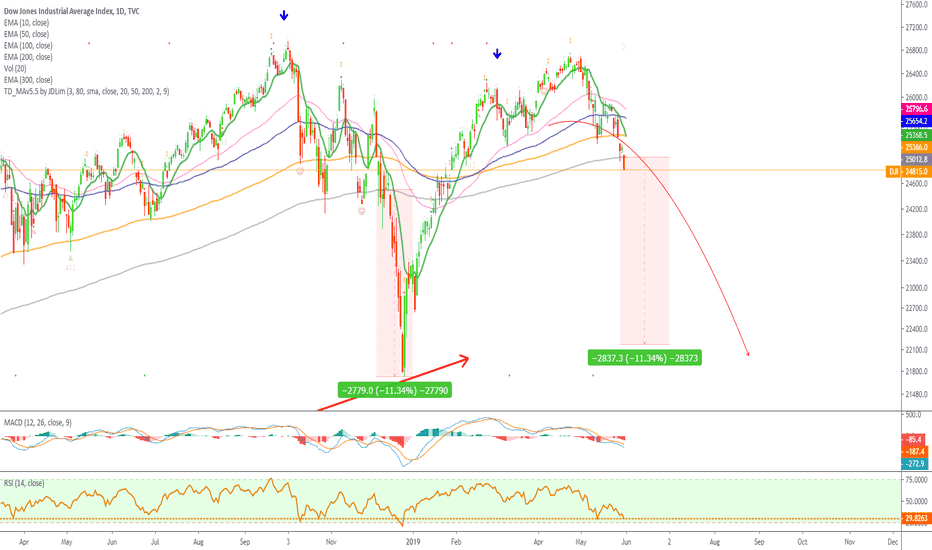
SPX


Trading Cryptocurrencies can be the hardest undertaking ever without the right trade-numbers, without accurate private-access information. Free is free, but the best always requires sweat, an investment. Since 2017 👇
t.me/masteranandatrades/8778
t.me/masteranandatrades/8778
Publikasi terkait
Pernyataan Penyangkalan
Informasi dan publikasi ini tidak dimaksudkan, dan bukan merupakan, saran atau rekomendasi keuangan, investasi, trading, atau jenis lainnya yang diberikan atau didukung oleh TradingView. Baca selengkapnya di Ketentuan Penggunaan.
Trading Cryptocurrencies can be the hardest undertaking ever without the right trade-numbers, without accurate private-access information. Free is free, but the best always requires sweat, an investment. Since 2017 👇
t.me/masteranandatrades/8778
t.me/masteranandatrades/8778
Publikasi terkait
Pernyataan Penyangkalan
Informasi dan publikasi ini tidak dimaksudkan, dan bukan merupakan, saran atau rekomendasi keuangan, investasi, trading, atau jenis lainnya yang diberikan atau didukung oleh TradingView. Baca selengkapnya di Ketentuan Penggunaan.