
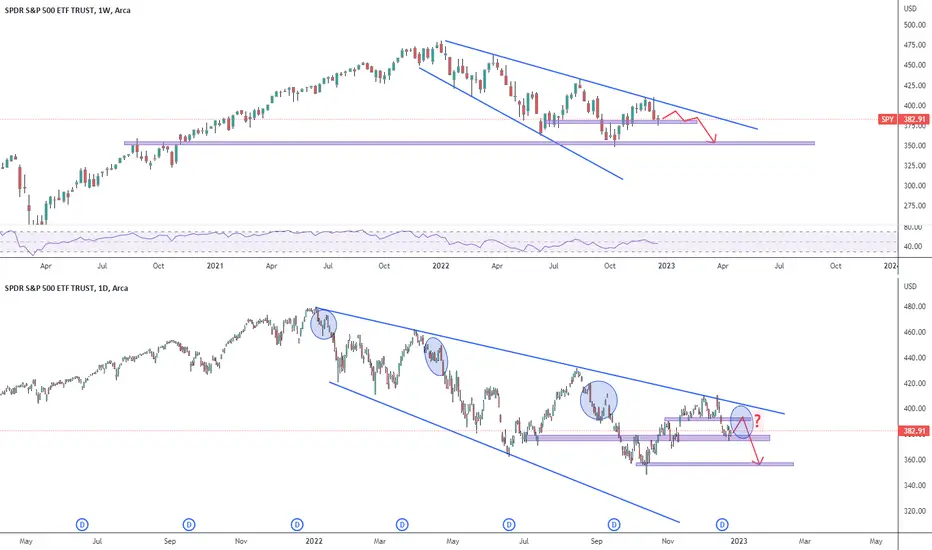
Top chart weekly timeframe, bottom chart daily timeframe. Price action on the top chart shows a Long Legged Doji candle at the $380 important support level. I think we will see a short term rally, retest the previous support now resistance $390 and then crash to the downside. I'm just waiting for the retest to open a short position.

Pernyataan Penyangkalan
Informasi dan publikasi ini tidak dimaksudkan, dan bukan merupakan, saran atau rekomendasi keuangan, investasi, trading, atau jenis lainnya yang diberikan atau didukung oleh TradingView. Baca selengkapnya di Ketentuan Penggunaan.
Pernyataan Penyangkalan
Informasi dan publikasi ini tidak dimaksudkan, dan bukan merupakan, saran atau rekomendasi keuangan, investasi, trading, atau jenis lainnya yang diberikan atau didukung oleh TradingView. Baca selengkapnya di Ketentuan Penggunaan.