
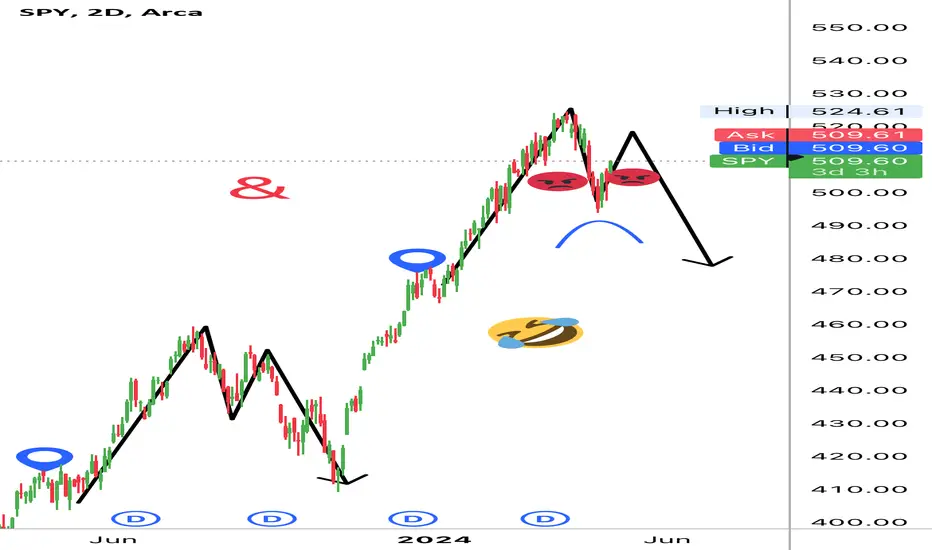
From a technical perspective, there hasn't been a definitive signal indicating a trend reversal for the SPY 500. Back in May to October 2023, the SPY exhibited a clear "M" pattern or double top, experiencing a drop of approximately 5%, retracing back, and then dropping around 10%, forming the M pattern.
If we compare this M pattern with the current price action, we observe a striking resemblance in the market behavior, as the price retraces from a similar percentage drop of around 5%. The question arises: Is the market genuinely recovering, or are we merely witnessing the formation of another M-shaped pattern!
If we compare this M pattern with the current price action, we observe a striking resemblance in the market behavior, as the price retraces from a similar percentage drop of around 5%. The question arises: Is the market genuinely recovering, or are we merely witnessing the formation of another M-shaped pattern!

By Dubai Traders Hub
Follow us on X , YouTube, and Join our Telegram Channel
Follow us on X , YouTube, and Join our Telegram Channel
Pernyataan Penyangkalan
Informasi dan publikasi ini tidak dimaksudkan, dan bukan merupakan, saran atau rekomendasi keuangan, investasi, trading, atau jenis lainnya yang diberikan atau didukung oleh TradingView. Baca selengkapnya di Ketentuan Penggunaan.
By Dubai Traders Hub
Follow us on X , YouTube, and Join our Telegram Channel
Follow us on X , YouTube, and Join our Telegram Channel
Pernyataan Penyangkalan
Informasi dan publikasi ini tidak dimaksudkan, dan bukan merupakan, saran atau rekomendasi keuangan, investasi, trading, atau jenis lainnya yang diberikan atau didukung oleh TradingView. Baca selengkapnya di Ketentuan Penggunaan.