
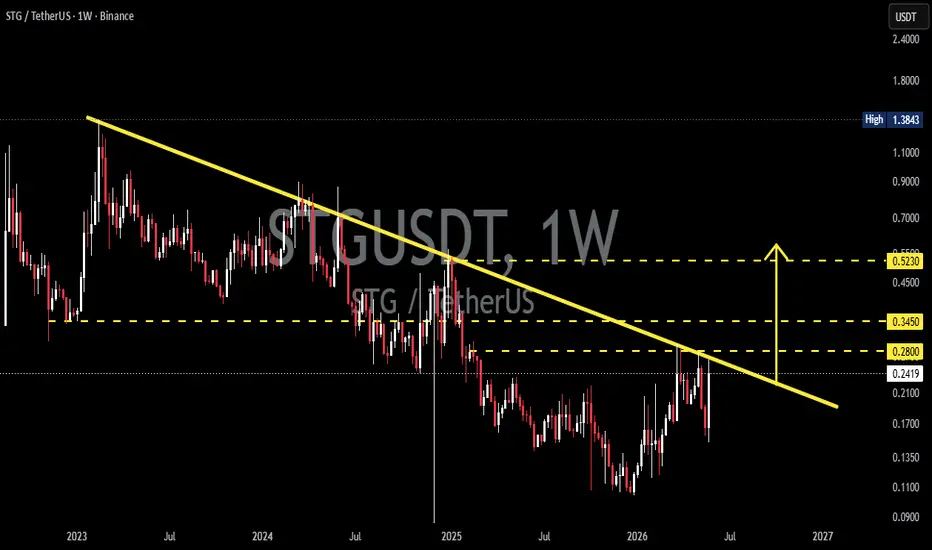
On the 1W (Weekly) timeframe, STG/USDT is still trading below a long-term Descending Trendline that has been suppressing price action since the 2023 peak. 📉 This trendline acts as a dynamic resistance, continuously creating Lower Highs (LH) and maintaining a bearish market structure over the long term.
However, the chart is beginning to show signs of recovery after forming a stronger base in the lower price region. 🔄 STG is currently testing a key resistance zone that coincides with the descending trendline.
⚠️ As long as price remains below the trendline and fails to secure a weekly close above it, the broader structure should still be considered Bearish-to-Neutral.
---
📉 Pattern Formation: Descending Trendline
🔍 Pattern Characteristics
✅ A declining resistance line connecting multiple significant swing highs.
✅ Reflects long-term seller dominance.
✅ The more times resistance is tested, the greater the probability of a breakout.
✅ A valid breakout is typically confirmed by increased volume and a weekly close above the trendline.
📌 On this chart, price has gradually returned to test the trendline after an extended accumulation phase, making the current area a crucial decision point for the next major trend direction.
---
🟢 Bullish Scenario
📈 Bullish Confirmation Requirements
✔️ Price successfully breaks above the Descending Trendline.
✔️ Weekly candle closes above trendline resistance.
✔️ A successful retest establishes new support.
If the breakout is confirmed, the potential upside targets are:
🎯 Target 1: $0.2800
🎯 Target 2: $0.3450
🎯 Target 3: $0.5230
🚀 The $0.5230 level represents a major resistance zone and serves as the primary long-term technical target following a breakout.
💡 If the broader cryptocurrency market maintains positive momentum, STG could enter a significant trend reversal phase after spending more than two years under bearish pressure.
---
🔴 Bearish Scenario
⚠️ Risks to Watch
❌ Price fails to break above the trendline.
❌ Strong rejection occurs at the current resistance zone.
❌ Weekly close falls back below nearby support levels.
If this scenario unfolds, selling pressure may regain control and push price back toward lower support zones.
📉 First Support: Around $0.1700
📉 Next Support: Around $0.1350
📉 Major Demand Zone: Around $0.1100
⚠️ As long as price remains below the Descending Trendline, the possibility of further rejection should not be ignored.
---
🔍 Conclusion
STG/USDT is currently at a critical stage after months of trading within a long-term bearish structure. 📊 The Descending Trendline that has constrained price action since 2023 is now being tested again, making this area a key decision point for the next major market move.
🟢 Bullish Scenario
📌 A breakout and weekly close above the trendline could open the door toward $0.2800, $0.3450, and eventually $0.5230.
🔴 Bearish Scenario
📌 Failure to break resistance could trigger renewed selling pressure and a move back toward lower support zones.
💎 Traders should wait for a confirmed breakout before anticipating a long-term trend reversal.
#STG #STGUSDT #StargateFinance #Crypto #Cryptocurrency #Altcoin #TechnicalAnalysis #TradingView #PriceAction #ChartAnalysis #Bullish #Bearish #Breakout #Trendline #DescendingTrendline #WeeklyChart #CryptoTrading #AltcoinSeason #SupportAndResistance #MarketAnalysis
However, the chart is beginning to show signs of recovery after forming a stronger base in the lower price region. 🔄 STG is currently testing a key resistance zone that coincides with the descending trendline.
⚠️ As long as price remains below the trendline and fails to secure a weekly close above it, the broader structure should still be considered Bearish-to-Neutral.
---
📉 Pattern Formation: Descending Trendline
🔍 Pattern Characteristics
✅ A declining resistance line connecting multiple significant swing highs.
✅ Reflects long-term seller dominance.
✅ The more times resistance is tested, the greater the probability of a breakout.
✅ A valid breakout is typically confirmed by increased volume and a weekly close above the trendline.
📌 On this chart, price has gradually returned to test the trendline after an extended accumulation phase, making the current area a crucial decision point for the next major trend direction.
---
🟢 Bullish Scenario
📈 Bullish Confirmation Requirements
✔️ Price successfully breaks above the Descending Trendline.
✔️ Weekly candle closes above trendline resistance.
✔️ A successful retest establishes new support.
If the breakout is confirmed, the potential upside targets are:
🎯 Target 1: $0.2800
🎯 Target 2: $0.3450
🎯 Target 3: $0.5230
🚀 The $0.5230 level represents a major resistance zone and serves as the primary long-term technical target following a breakout.
💡 If the broader cryptocurrency market maintains positive momentum, STG could enter a significant trend reversal phase after spending more than two years under bearish pressure.
---
🔴 Bearish Scenario
⚠️ Risks to Watch
❌ Price fails to break above the trendline.
❌ Strong rejection occurs at the current resistance zone.
❌ Weekly close falls back below nearby support levels.
If this scenario unfolds, selling pressure may regain control and push price back toward lower support zones.
📉 First Support: Around $0.1700
📉 Next Support: Around $0.1350
📉 Major Demand Zone: Around $0.1100
⚠️ As long as price remains below the Descending Trendline, the possibility of further rejection should not be ignored.
---
🔍 Conclusion
STG/USDT is currently at a critical stage after months of trading within a long-term bearish structure. 📊 The Descending Trendline that has constrained price action since 2023 is now being tested again, making this area a key decision point for the next major market move.
🟢 Bullish Scenario
📌 A breakout and weekly close above the trendline could open the door toward $0.2800, $0.3450, and eventually $0.5230.
🔴 Bearish Scenario
📌 Failure to break resistance could trigger renewed selling pressure and a move back toward lower support zones.
💎 Traders should wait for a confirmed breakout before anticipating a long-term trend reversal.
#STG #STGUSDT #StargateFinance #Crypto #Cryptocurrency #Altcoin #TechnicalAnalysis #TradingView #PriceAction #ChartAnalysis #Bullish #Bearish #Breakout #Trendline #DescendingTrendline #WeeklyChart #CryptoTrading #AltcoinSeason #SupportAndResistance #MarketAnalysis

✅ Get Free Signals! Join Our Telegram Channel Here: t.me/TheCryptoNuclear
✅ Twitter: twitter.com/crypto_nuclear
✅ Join Bybit : partner.bybit.com/b/nuclearvip
✅ Benefits : Lifetime Trading Fee Discount -50%
✅ Twitter: twitter.com/crypto_nuclear
✅ Join Bybit : partner.bybit.com/b/nuclearvip
✅ Benefits : Lifetime Trading Fee Discount -50%
Pernyataan Penyangkalan
Informasi dan publikasi ini tidak dimaksudkan, dan bukan merupakan, saran atau rekomendasi keuangan, investasi, trading, atau jenis lainnya yang diberikan atau didukung oleh TradingView. Baca selengkapnya di Ketentuan Penggunaan.
✅ Get Free Signals! Join Our Telegram Channel Here: t.me/TheCryptoNuclear
✅ Twitter: twitter.com/crypto_nuclear
✅ Join Bybit : partner.bybit.com/b/nuclearvip
✅ Benefits : Lifetime Trading Fee Discount -50%
✅ Twitter: twitter.com/crypto_nuclear
✅ Join Bybit : partner.bybit.com/b/nuclearvip
✅ Benefits : Lifetime Trading Fee Discount -50%
Pernyataan Penyangkalan
Informasi dan publikasi ini tidak dimaksudkan, dan bukan merupakan, saran atau rekomendasi keuangan, investasi, trading, atau jenis lainnya yang diberikan atau didukung oleh TradingView. Baca selengkapnya di Ketentuan Penggunaan.