STRAT Technical Analysis & Fundamental Analysis
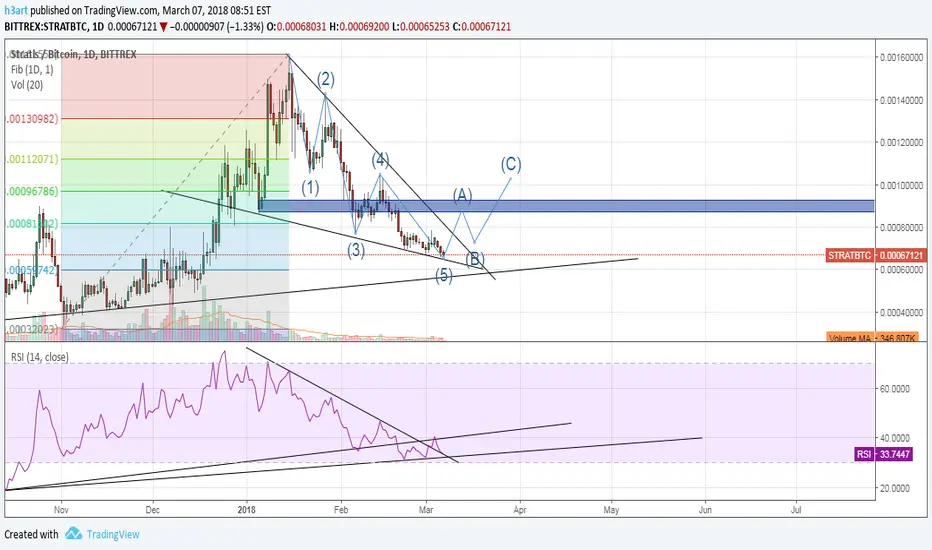
Technical Analysis:-
RSI: RSI showing Bull Div. which is reversal sign in midterm not in Long Term
MACD: MACD Histogram also showing Bull Div. which is reversal sign in Mid Term
Volume: Volume is Not Yet Spiked, whales have not enter which will bring down after little bit up Because No Proper Reversal has been seen in any indicator in long run even Weekly and Monthly Chart Still looks Bearish.
Triangle: In 1d chart it is making Descending triangle if it break this then it will take long dip near 50
Long Term: May be coming months it will be start It's Bullish trend for Long Term
Fundamental Analysis:
Mid Term Chart is Bullish due to some upcoming positive News, Next Month in March there are some news
1- ICO on Strat Platform
2- Smart Contract
3- Alpha Release
4- iOS app
For Free Trading Signals Join: t.me/cryptoheights
RSI: RSI showing Bull Div. which is reversal sign in midterm not in Long Term
MACD: MACD Histogram also showing Bull Div. which is reversal sign in Mid Term
Volume: Volume is Not Yet Spiked, whales have not enter which will bring down after little bit up Because No Proper Reversal has been seen in any indicator in long run even Weekly and Monthly Chart Still looks Bearish.
Triangle: In 1d chart it is making Descending triangle if it break this then it will take long dip near 50
Long Term: May be coming months it will be start It's Bullish trend for Long Term
Fundamental Analysis:
Mid Term Chart is Bullish due to some upcoming positive News, Next Month in March there are some news
1- ICO on Strat Platform
2- Smart Contract
3- Alpha Release
4- iOS app
For Free Trading Signals Join: t.me/cryptoheights

Pernyataan Penyangkalan
Informasi dan publikasi ini tidak dimaksudkan, dan bukan merupakan, saran atau rekomendasi keuangan, investasi, trading, atau jenis lainnya yang diberikan atau didukung oleh TradingView. Baca selengkapnya di Ketentuan Penggunaan.
Pernyataan Penyangkalan
Informasi dan publikasi ini tidak dimaksudkan, dan bukan merupakan, saran atau rekomendasi keuangan, investasi, trading, atau jenis lainnya yang diberikan atau didukung oleh TradingView. Baca selengkapnya di Ketentuan Penggunaan.