
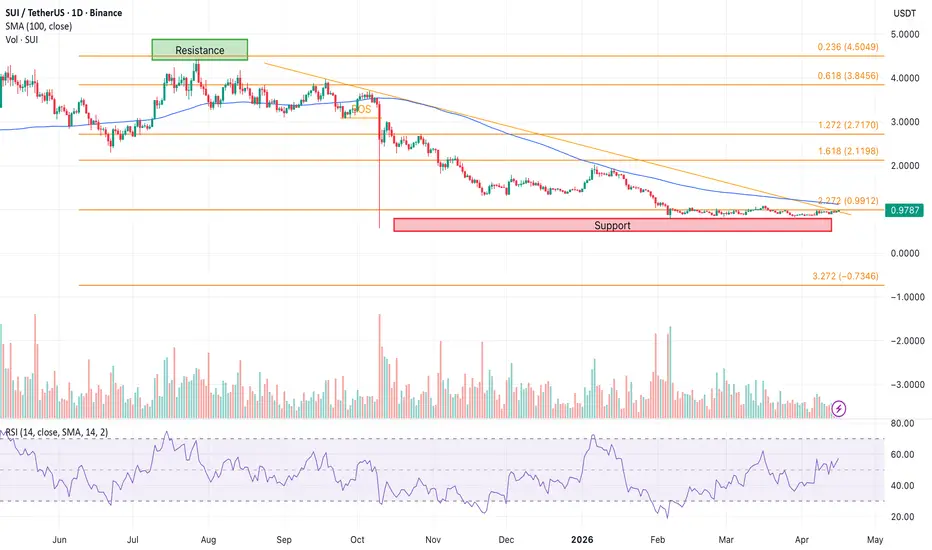
* SUI price shows long-term upside with Fibonacci targets near $3.70 and higher.
* Short-term trend remains bearish with resistance holding near $0.96.
* An 83% drawdown and stable market cap hint at a possible cycle bottom.
When you zoom out and look at SUI, the picture splits in two directions. On one hand, long-term Fibonacci targets point to $3.70, $4.50, and beyond. On the other, the 4-hour chart shows a clean downtrend with lower highs and resistance holding near $0.96. Both views are right. They just operate on different timelines.
For months, SUI has been grinding. The daily chart shows a powerful breakout that followed consolidation, but the rejection at higher levels brought sellers right back in. That kind of action drains short-term confidence. Traders get whipsawed, momentum fades, and conviction gets tested.
SUI is now down over 83% from its all-time high. That drawdown is uncomfortable. But historically, that's also where cycle bottoms tend to form. The market cap has been holding steady near $3.6 to $3.8 billion, not freefalling. That indicates digestion, not panic. And the daily Fibonacci levels still point higher: $2.11, $2.71, $3.84, $4.50. The path exists, even if the price isn't taking it yet.
The short-term chart doesn't look good. The 4-hour shows a downtrend line formed from recent peaks, and as long as SUI stays below that line, bearish momentum prevails. Resistance sits near $0.96–$0.98. Support waits at $0.92, then $0.90, then $0.85. The RSI is neutral on both timeframes, no oversold signal to lean on.
But the long-term structure tells a different story. SUI has been gaining attention from funds and developers because of its technical performance. If that attention turns into real capital inflows, the rerating could be significant. The $25 projection is extreme. But it's based on a real idea: Sui capturing a meaningful share of the layer-one market.
From here, what matters is one level: $0.96. A break above that with volume would flip the short-term trend to bullish and open the path to $1.00, then $1.50, then the Fibonacci targets beyond. A failure to break and another rejection would send SUI back toward $0.90 and potentially lower.
* Short-term trend remains bearish with resistance holding near $0.96.
* An 83% drawdown and stable market cap hint at a possible cycle bottom.
When you zoom out and look at SUI, the picture splits in two directions. On one hand, long-term Fibonacci targets point to $3.70, $4.50, and beyond. On the other, the 4-hour chart shows a clean downtrend with lower highs and resistance holding near $0.96. Both views are right. They just operate on different timelines.
For months, SUI has been grinding. The daily chart shows a powerful breakout that followed consolidation, but the rejection at higher levels brought sellers right back in. That kind of action drains short-term confidence. Traders get whipsawed, momentum fades, and conviction gets tested.
SUI is now down over 83% from its all-time high. That drawdown is uncomfortable. But historically, that's also where cycle bottoms tend to form. The market cap has been holding steady near $3.6 to $3.8 billion, not freefalling. That indicates digestion, not panic. And the daily Fibonacci levels still point higher: $2.11, $2.71, $3.84, $4.50. The path exists, even if the price isn't taking it yet.
The short-term chart doesn't look good. The 4-hour shows a downtrend line formed from recent peaks, and as long as SUI stays below that line, bearish momentum prevails. Resistance sits near $0.96–$0.98. Support waits at $0.92, then $0.90, then $0.85. The RSI is neutral on both timeframes, no oversold signal to lean on.
But the long-term structure tells a different story. SUI has been gaining attention from funds and developers because of its technical performance. If that attention turns into real capital inflows, the rerating could be significant. The $25 projection is extreme. But it's based on a real idea: Sui capturing a meaningful share of the layer-one market.
From here, what matters is one level: $0.96. A break above that with volume would flip the short-term trend to bullish and open the path to $1.00, then $1.50, then the Fibonacci targets beyond. A failure to break and another rejection would send SUI back toward $0.90 and potentially lower.

Publikasi terkait
Pernyataan Penyangkalan
Informasi dan publikasi ini tidak dimaksudkan, dan bukan merupakan, saran atau rekomendasi keuangan, investasi, trading, atau jenis lainnya yang diberikan atau didukung oleh TradingView. Baca selengkapnya di Ketentuan Penggunaan.
Publikasi terkait
Pernyataan Penyangkalan
Informasi dan publikasi ini tidak dimaksudkan, dan bukan merupakan, saran atau rekomendasi keuangan, investasi, trading, atau jenis lainnya yang diberikan atau didukung oleh TradingView. Baca selengkapnya di Ketentuan Penggunaan.