
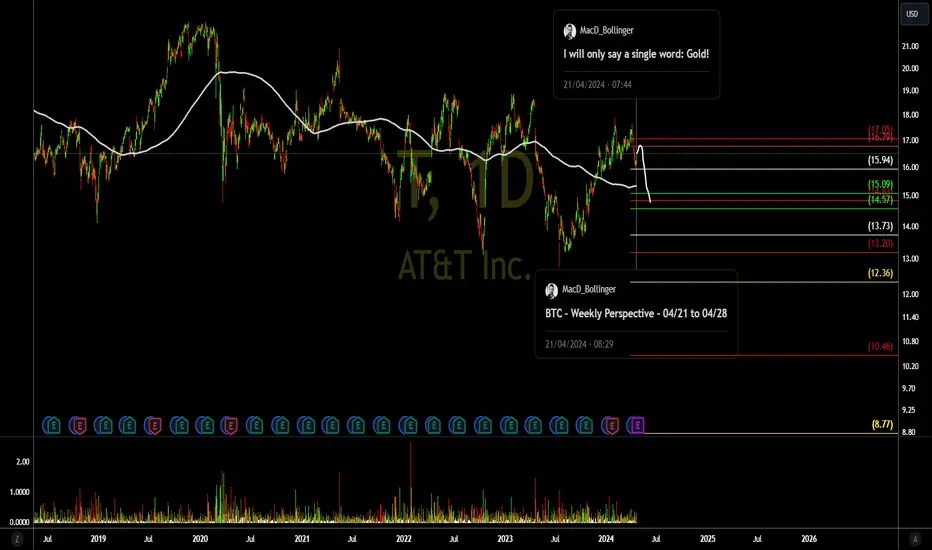
From the graph we have a great possibility. If prices do not overcome the 17.05 region we can see prices seeking first the long average (white line) and then the 15.09 and 14.83 bands (support).
For this to happen, prices must drop below 15.95, as shown below.

Resistances: 16.79 and 17.05.
Supports: 15.09 and 14.83.
The value of 14.83 is a possible target with the loss of the 15.94 region.
Do your analysis and good business.
Be aware, if you buy, use stop loss.
See other graphical analyzes below.
For this to happen, prices must drop below 15.95, as shown below.
Resistances: 16.79 and 17.05.
Supports: 15.09 and 14.83.
The value of 14.83 is a possible target with the loss of the 15.94 region.
Do your analysis and good business.
Be aware, if you buy, use stop loss.
See other graphical analyzes below.

Publikasi terkait
Pernyataan Penyangkalan
Informasi dan publikasi ini tidak dimaksudkan, dan bukan merupakan, saran atau rekomendasi keuangan, investasi, trading, atau jenis lainnya yang diberikan atau didukung oleh TradingView. Baca selengkapnya di Ketentuan Penggunaan.
Publikasi terkait
Pernyataan Penyangkalan
Informasi dan publikasi ini tidak dimaksudkan, dan bukan merupakan, saran atau rekomendasi keuangan, investasi, trading, atau jenis lainnya yang diberikan atau didukung oleh TradingView. Baca selengkapnya di Ketentuan Penggunaan.