
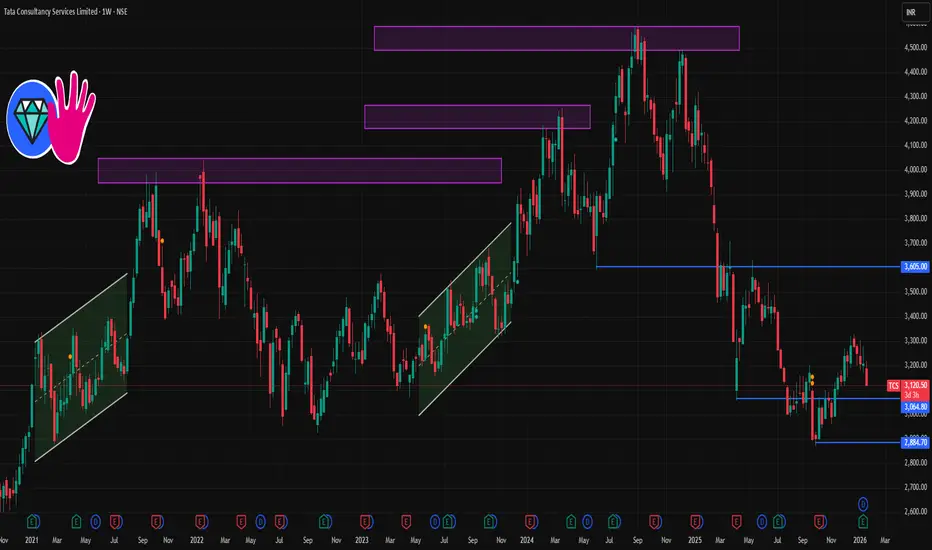
📌 Current Price Reference
TCS is trading around ₹3,120–₹3,140 on the NSE recently.
📉 Key Weekly Levels (Support & Resistance)
🔹 Support Levels (Weekly)
1. ~₹3,137 – near immediate weekly support zone.
2. ~₹3,111 – next support under current price.
3. ~₹3,069 – deeper weekly support below recent lows.
4. ~₹2,867 – 52-week low area (major support if breakdown persists).
These levels are typical bounce/zones to watch on a weekly timeframe if the stock slides further.
🔺 Resistance Levels (Weekly)
1. ~₹3,205 – immediate weekly resistance.
2. ~₹3,246–₹3,273 – medium resistance that may cap upside rallies.
3. ~₹3,300+ – round psychological resistance zone.
A break above ~₹3,205–₹3,246 area on weekly closing could suggest short-term bullish momentum.
📌 1-Week Trading Range (Indicative)
Bearish/breakdown range: ₹3,069 – ₹2,867 (if weakness continues)
Neutral range: ₹3,069 – ₹3,205
Bullish breakout range: above ₹3,205 up to ₹3,273+

Contact Knowledgehub for a detailed consultation: Dm on WhatsApp: [wa.link/a2o0kz]-
Phone No: [+91 93102 26243]-
Email: [tradingviewknowledgehub@gmail.com]---
-- Let’s achieve success together!
Phone No: [+91 93102 26243]-
Email: [tradingviewknowledgehub@gmail.com]---
-- Let’s achieve success together!
Publikasi terkait
Pernyataan Penyangkalan
Informasi dan publikasi ini tidak dimaksudkan, dan bukan merupakan, saran atau rekomendasi keuangan, investasi, trading, atau jenis lainnya yang diberikan atau didukung oleh TradingView. Baca selengkapnya di Ketentuan Penggunaan.