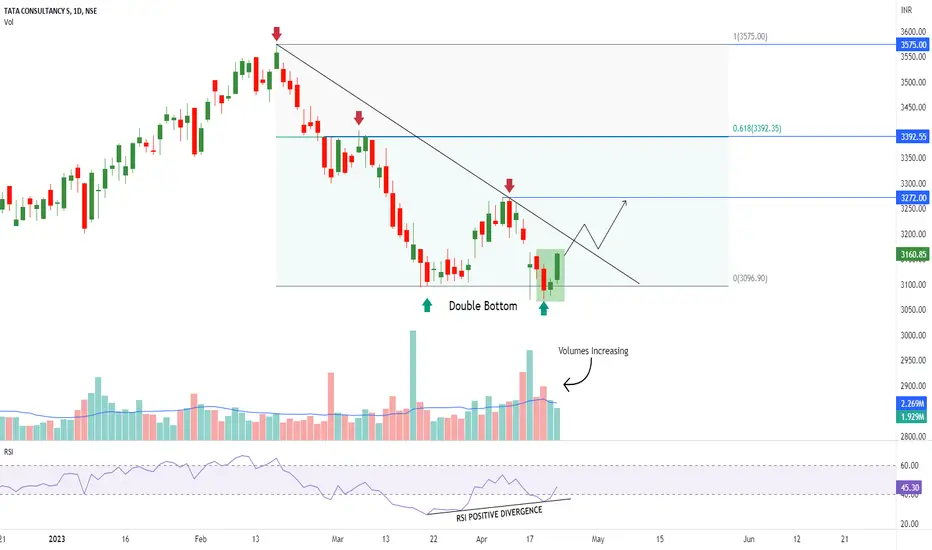
 TCS is trading at its important weekly support level.
On Daily chart it has formed kind of Morning Star Candlestick Pattern & Double Bottom Price Action Pattern.
Positive RSI Divergence is also seen.
Volume is still rising, which suggests that there is more upside potential for the stock.
- Support- 3100
Resistance- 3275/3400/3575

Pernyataan Penyangkalan
Informasi dan publikasi ini tidak dimaksudkan, dan bukan merupakan, saran atau rekomendasi keuangan, investasi, trading, atau jenis lainnya yang diberikan atau didukung oleh TradingView. Baca selengkapnya di Ketentuan Penggunaan.
Pernyataan Penyangkalan
Informasi dan publikasi ini tidak dimaksudkan, dan bukan merupakan, saran atau rekomendasi keuangan, investasi, trading, atau jenis lainnya yang diberikan atau didukung oleh TradingView. Baca selengkapnya di Ketentuan Penggunaan.