
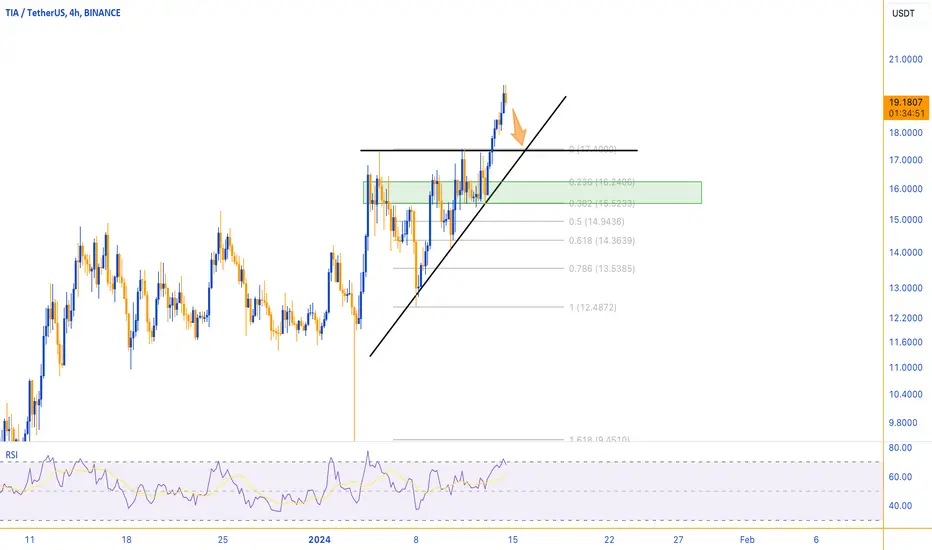
• As observed, there has been a recent development on the 4-hour TIA chart, indicating the formation of a triangle.
• In the last few candles, a breakout has occurred through the triangle's upper boundary.
• It is important to note, however, that the consolidating candles are not yet formed.
• Therefore, it is reasonable to expect a pullback in this vicinity.
• Following the pullback, a continuation of the upward price movement is anticipated.
(All analyses will be updated)
This analysis is informational, not financial advice.
• In the last few candles, a breakout has occurred through the triangle's upper boundary.
• It is important to note, however, that the consolidating candles are not yet formed.
• Therefore, it is reasonable to expect a pullback in this vicinity.
• Following the pullback, a continuation of the upward price movement is anticipated.
(All analyses will be updated)
This analysis is informational, not financial advice.

Join the free Telegram channel
💎 Telegram Channel: t.me/MonoCoin_Public
🔔 Bot: t.me/MonoCoinSignal_Bot?start=starter_tv
🌐 Website: MonoCoin.net
⭐️ 5-Star TrustPilot: trustpilot.com/review/monocoin.net
💎 Telegram Channel: t.me/MonoCoin_Public
🔔 Bot: t.me/MonoCoinSignal_Bot?start=starter_tv
🌐 Website: MonoCoin.net
⭐️ 5-Star TrustPilot: trustpilot.com/review/monocoin.net
Pernyataan Penyangkalan
Informasi dan publikasi ini tidak dimaksudkan, dan bukan merupakan, saran atau rekomendasi keuangan, investasi, trading, atau jenis lainnya yang diberikan atau didukung oleh TradingView. Baca selengkapnya di Ketentuan Penggunaan.
Join the free Telegram channel
💎 Telegram Channel: t.me/MonoCoin_Public
🔔 Bot: t.me/MonoCoinSignal_Bot?start=starter_tv
🌐 Website: MonoCoin.net
⭐️ 5-Star TrustPilot: trustpilot.com/review/monocoin.net
💎 Telegram Channel: t.me/MonoCoin_Public
🔔 Bot: t.me/MonoCoinSignal_Bot?start=starter_tv
🌐 Website: MonoCoin.net
⭐️ 5-Star TrustPilot: trustpilot.com/review/monocoin.net
Pernyataan Penyangkalan
Informasi dan publikasi ini tidak dimaksudkan, dan bukan merupakan, saran atau rekomendasi keuangan, investasi, trading, atau jenis lainnya yang diberikan atau didukung oleh TradingView. Baca selengkapnya di Ketentuan Penggunaan.