 Turkcell Iletisim Hizmetleri AS
Pembelian
TKC – Multi-Year Inverse Head & Shoulders Formation Potential
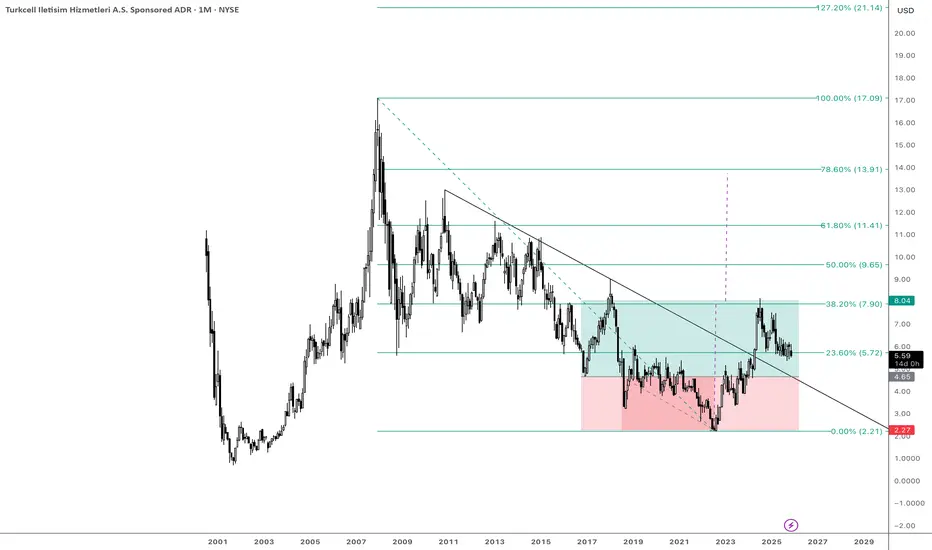
A potential multi-year inverse Head & Shoulders structure appears to be developing on Turkcell’s U.S. ADR (TKC) monthly chart.
This is a slow-forming, long-cycle reversal pattern, so completion may take time even few years — also future dividend adjustments will naturally shift the historical price anchors on the ADR chart.
The neckline sits around the 8.00 USD area.
A monthly close above 8.00 would be the structural trigger confirming the reversal.
The measured move from head to neckline projects toward the 13.70 USD area.
This level also aligns with a major Fib confluence zone:
• 61.8% retracement of the 2007 high → 2022 low
• 78.6% retracement — both cluster between ~13–14 USD, reinforcing the significance of that target zone.
Invalidation sits below 4.22 USD.
A sustained move under this level would break the right-shoulder structure and negate the multi-year reversal thesis.
This setup is worth monitoring — high-timeframe reversals can be slow to complete, but meaningful when they do.
Macro note : This stock sensitive to Türkiye’s economical outlook.
Focus on the chart, not the headlines.
(Educational idea – not financial advice.)

Pernyataan Penyangkalan
Informasi dan publikasi ini tidak dimaksudkan, dan bukan merupakan, saran atau rekomendasi keuangan, investasi, trading, atau jenis lainnya yang diberikan atau didukung oleh TradingView. Baca selengkapnya di Ketentuan Penggunaan.
Pernyataan Penyangkalan
Informasi dan publikasi ini tidak dimaksudkan, dan bukan merupakan, saran atau rekomendasi keuangan, investasi, trading, atau jenis lainnya yang diberikan atau didukung oleh TradingView. Baca selengkapnya di Ketentuan Penggunaan.